
Wednesday saw markets try to stabilize. For most of the day the S&P was in the green and pressuring the 2900 level but unable to break through as volumes remained too low to break higher.
The final half hour saw computerized selling spiking volume and sending all 3 indexes into negative closes.
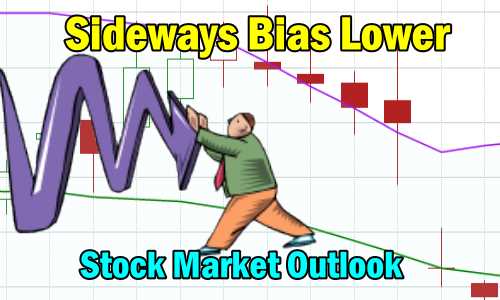
Stock Market Outlook Chart Comments At The Close on Wed May 8 2019
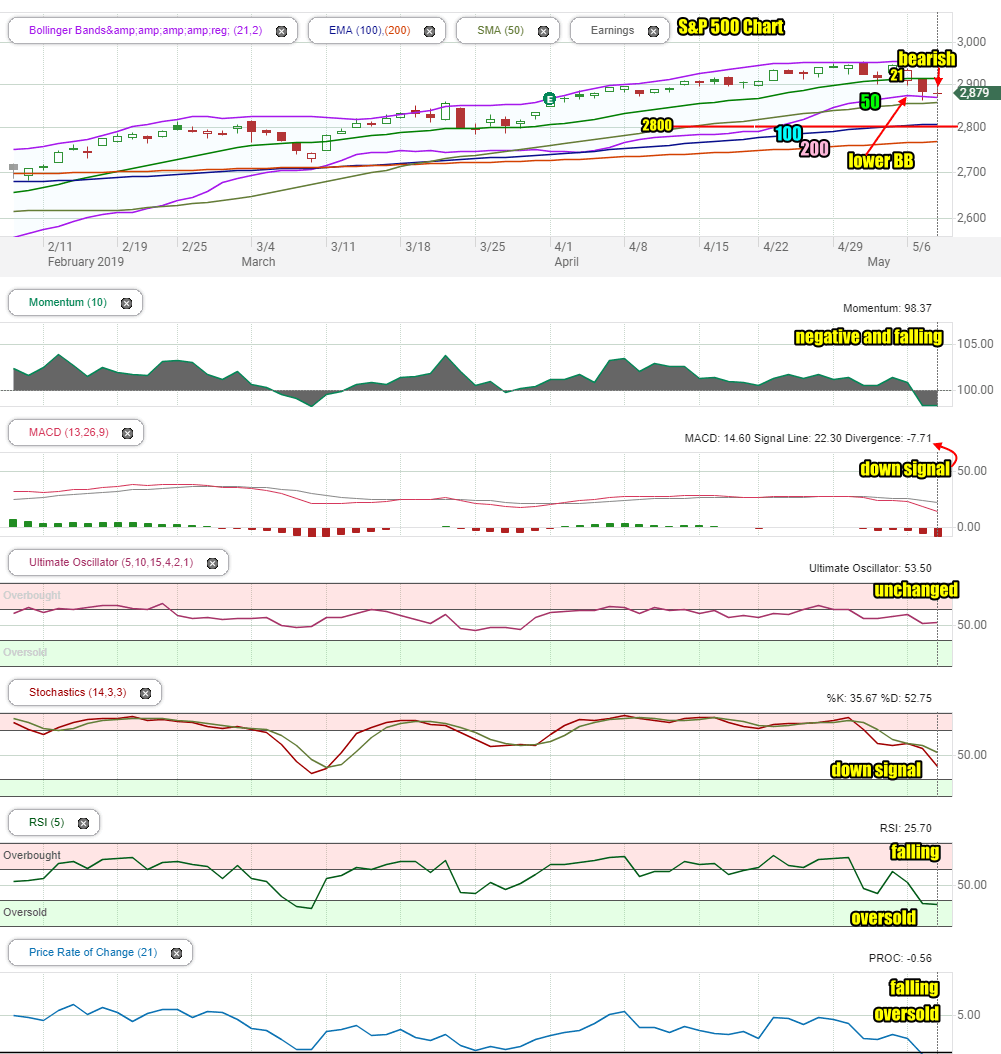
On Wednesday the S&P traded below the 21 day moving average all day and and reached the Lower Bollinger Band, both bearish signals.
The closing candlestick on Wednesday is bearish for Thursday despite being left in an oversold condition on Wednesday.
Note that Wednesday did not see the SPX fall as low as it did on Tuesday which may assist investors on Thursday in trying to establish a bottom, even an interim one.
TThe Bollinger Bands Squeeze is underway and the outlook is for a move lower for the index.
All the major moving averages are moving ahead with the 50 day and 100 day both moving away from the 200 day. The 100 day is now above the 2800 level.
Overall however the chart is turning bearish.
Stock Market Outlook review of Wed May 8 2019
Stock Market Outlook: Technical Indicators Review:
Momentum: Momentum is negative and falling.
- Settings: For momentum I use a 10 period when studying market direction.
MACD Histogram: MACD (Moving Averages Convergence / Divergence) issued a down signal on Wednesday May 1. On Wednesday the down signal was stronger again.
- Settings: For MACD Histogram, I am using the Fast Points set at 13, Slow Points at 26 and Smoothing at 9.
Ultimate Oscillator: The Ultimate Oscillator signal is positive and unchanged but ready to turn negative.
- Settings: The Ultimate Oscillator settings are: Period 1 is 5, Period 2 is 10, Period 3 is 15, Factor 1 is 4, Factor 2 is 2 and Factor 3 is 1. These are not the default settings but are the settings I use with the S&P 500 chart set for 1 to 3 months.
Slow Stochastic: The Slow Stochastic has a strong down signal in place.
- Settings: For the Slow Stochastic I use the K period of 14 and D period of 3. The Slow Stochastic tries to predict the market direction further out than just one day.
Relative Strength Index: The RSI signal is falling and is oversold. It is reaching levels where shortly a bounce should be expected.
- Settings: The relative strength index is set for a period of 5 which gives it 5 days of market movement to monitor. It is often the first indicator to show an overbought or oversold signal.
Rate of Change: The rate of change signal is falling and is at levels where it is oversold and a bounce could be expected.
- Settings: Rate Of Change is set for a 21 period. This indicator looks back 21 days and compares price action from the past to the present. With the Rate Of Change, prices are rising when signals are positive. Conversely, prices are falling when signals are negative. As an advance rises the Rate Of Change signal should also rise higher, otherwise the rally is suspect. A decline should see the Rate Of Change fall into negative signals. The more negative the signals the stronger the decline.
Support Resistance Levels To Be Aware Of:
2950 is resistance
2900 is light support
2860 is light support
2830 is light support
2800 is strong support
2795 is light support
2745 to 2750 is light support
2725 is light support
2700 is light support
2675 is light support
2650 is support
2625 is light support
2600 is support.
There was good support at the 2550 level which is back to being support.
The 2500 level is support.
The S&P has light support at 2480 and better support at 2450.
There is good support at 2425.
Below that there is some support at 2400, 2380, 2350.
Stock Market Outlook for Tomorrow – Thu May 9 2019
The technical indicators are all pointing to weakness to continue. Thursday may see the index move sideways as investors wait for word on the trade talks on Friday as well as the IPO from Uber.
Overall the chart is bearish but not overly concerning as it is still within easy striking distance of its highs. It won’t take much at this point to send the index back up but it also won’t need much to fall lower.
Investors will probably stay on the sidelines on Thursday which will probably mean the index will close negative.
2860 is support for the market followed by 2830 and then strong support is at 2800.
Stocks are in need of a catalyst to the upside. We saw such an attempt following positive tweets from the President on the China trade talks.
Thursday though will see more weakness although another bounce attempt in the morning is likely, followed by a negative lunch hour or afternoon. The close will be lower on Thursday but I am not expecting a large move lower.
Stock Market Outlook Archives
Stock Market Outlook For Wed May 6 2026 – Choppy But Higher Still

Morning Investing Strategy Notes for Tue May 5 2026

Stock Market Outlook For Tue May 5 2026 – Overbought and Lower

Morning Investing Strategy Notes for Mon May 4 2026
Stock Market Outlook For Mon May 4 2026 – Dips Likely With Possible Lower Close

Morning Investing Strategy Notes for Fri May 1 2026
Stock Market Outlook For Fri May 1 2026 – Overbought But Higher

Morning Investing Strategy Notes for Thu Apr 30 2026
Stock Market Outlook For Thu Apr 30 2026 – Dips Likely Possible Lower Close
Morning Investing Strategy Notes for Wed Apr 29 2026
Stock Market Outlook For Wed Apr 29 2026 – Choppy But Higher Ahead Of More Earnings

Morning Investing Strategy Notes for Tue Apr 28 2026