

Three events were important on Wednesday. First was the break of the 2800 level as the S&P opened below it at the open and the failure to recover it. The second event was the recovery in the afternoon showing buyers are still interested in picking up stocks on dips. The third was the drop below the 200 day moving average and then the close just slightly above it.
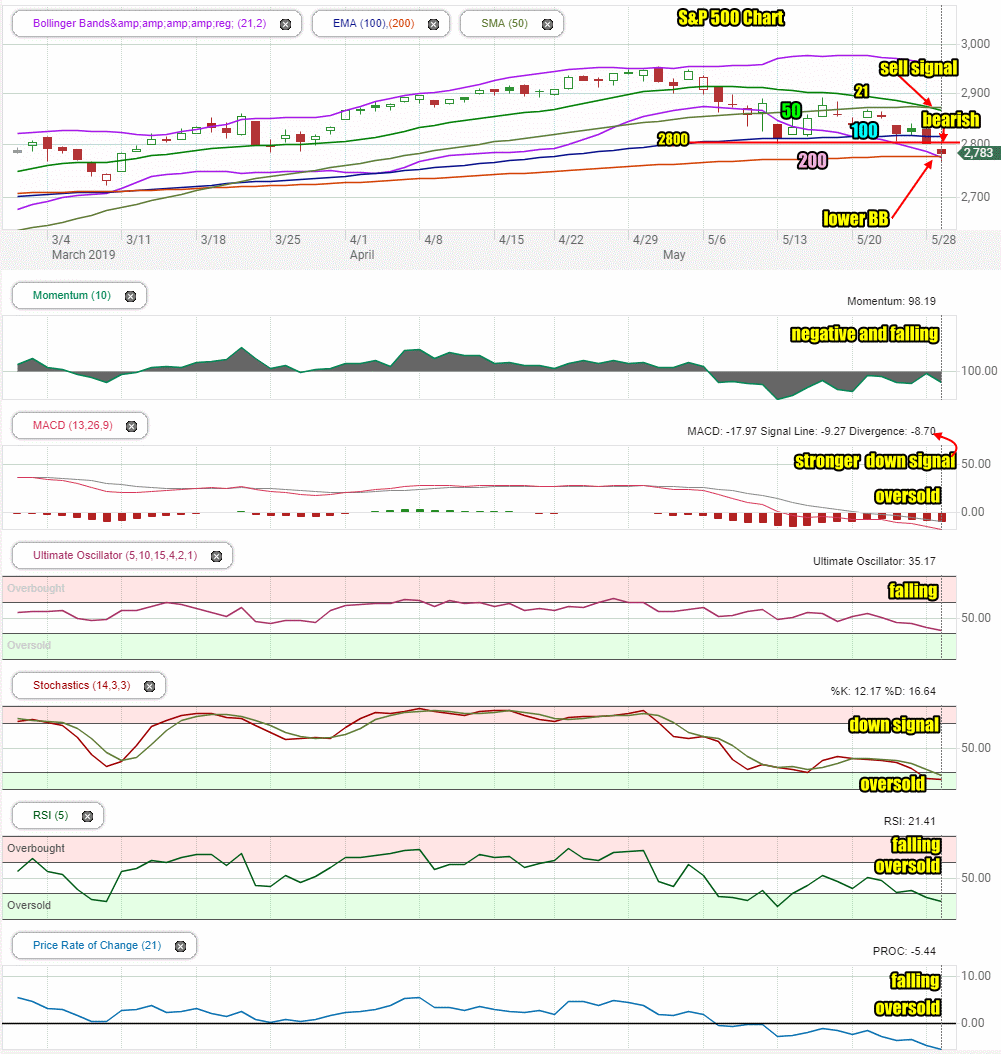
Stock Market Outlook Chart Comments At The Close on Wed May 29 2019
On Wednesday the index closed just above 200 day moving average after breaking through it at the start of the lunch hour. The 21 day moving average is further below the 50 day after Wednesday’s selling confirming yesterday’s sell signal. This is the first sell signal from the moving averages in 3 months.
The candlestick at the close pointed to another bearish day for Wednesday. As well the Lower Bollinger Band is now below the 2800 valuation and the 200 day moving average which are bearish signals.
The chart at the close on Wednesday is quite bearish and points to more downside to come but first there are a number of signs pointing to a bounce. For one, it would be rare for the index to break the 2800 support level without rebounding. Second would be the close back above the 200 day moving average. Almost always there is a bounce off important technical indicators like the major moving averages and the 200 day is the most major of all moving averages.
Stock market outlook review of Wed May 29 2019
Stock Market Outlook: Technical Indicators Review:
Momentum: Momentum is negative and falling.
- Settings: For momentum I use a 10 period when studying market direction.
MACD Histogram: MACD (Moving Averages Convergence / Divergence) issued a down signal on Wednesday May 1. On Wednesday the down signal gained strength pointing to more downside ahead. It is though oversold.
- Settings: For MACD Histogram, I am using the Fast Points set at 13, Slow Points at 26 and Smoothing at 9.
Ultimate Oscillator: The Ultimate Oscillator signal is falling and still moving lower.
- Settings: The Ultimate Oscillator settings are: Period 1 is 5, Period 2 is 10, Period 3 is 15, Factor 1 is 4, Factor 2 is 2 and Factor 3 is 1. These are not the default settings but are the settings I use with the S&P 500 chart set for 1 to 3 months.
Slow Stochastic: The Slow Stochastic signal is pointing down for stocks but is into oversold readings which normally point to a bounce.
- Settings: For the Slow Stochastic I use the K period of 14 and D period of 3. The Slow Stochastic tries to predict the market direction further out than just one day.
Relative Strength Index: The RSI signal is falling and into oversold readings.
- Settings: The relative strength index is set for a period of 5 which gives it 5 days of market movement to monitor. It is often the first indicator to show an overbought or oversold signal.
Rate of Change: The rate of change signal is falling and at oversold readings.
- Settings: Rate Of Change is set for a 21 period. This indicator looks back 21 days and compares price action from the past to the present. With the Rate Of Change, prices are rising when signals are positive. Conversely, prices are falling when signals are negative. As an advance rises the Rate Of Change signal should also rise higher, otherwise the rally is suspect. A decline should see the Rate Of Change fall into negative signals. The more negative the signals the stronger the decline.
Support Resistance Levels To Be Aware Of:
2950 is resistance
2900 is resistance
2860 is light resistance
2830 is light resistance
2800 is strong support
2795 is light support
2745 to 2750 is light support
2725 is light support
2700 is light support
2675 is light support
2650 is support
2625 is light support
2600 is support.
There was good support at the 2550 level which is back to being support.
The 2500 level is support.
The S&P has light support at 2480 and better support at 2450.
There is good support at 2425.
Below that there is some support at 2400, 2380, 2350.
Stock Market Outlook for Tomorrow – Thu May 30 2019
For Thursday the chart is bearish as are the technical indicators. But they are also pointing to a very oversold market that is right at the 200 day moving average. As well the 2800 level is strong support and the chance that the market won’t recover it at least one time is very small.
Therefore a bounce should be expected for Thursday and if there is not one, which is very unlikely, we should see one on Friday. While the bounce could be dramatic, the likelihood that it ends the sell-off is small. We should see the markets turn lower again after the bounce.
Stock Market Outlook Archives
Stock Market Outlook For Wed May 6 2026 – Choppy But Higher Still

Morning Investing Strategy Notes for Tue May 5 2026

Stock Market Outlook For Tue May 5 2026 – Overbought and Lower

Morning Investing Strategy Notes for Mon May 4 2026
Stock Market Outlook For Mon May 4 2026 – Dips Likely With Possible Lower Close

Morning Investing Strategy Notes for Fri May 1 2026
Stock Market Outlook For Fri May 1 2026 – Overbought But Higher

Morning Investing Strategy Notes for Thu Apr 30 2026
Stock Market Outlook For Thu Apr 30 2026 – Dips Likely Possible Lower Close
Morning Investing Strategy Notes for Wed Apr 29 2026
Stock Market Outlook For Wed Apr 29 2026 – Choppy But Higher Ahead Of More Earnings

Morning Investing Strategy Notes for Tue Apr 28 2026