
Wednesday May 1 saw the S&P make another new all-time intraday high. Then selling commenced after Fed Chair Powell’s interest rate decision and news conference in which he seemed to make it clear that an interest rate cut was not in the near future. When selling started more investors joined in with many unsure why there was so much selling. By the end of the day the index closed for its worse one day loss since March 22, down 22 points for a loss of three-quarters of a percent.
Stock Market Outlook Chart Comments At The Close on Wed May 1 2019
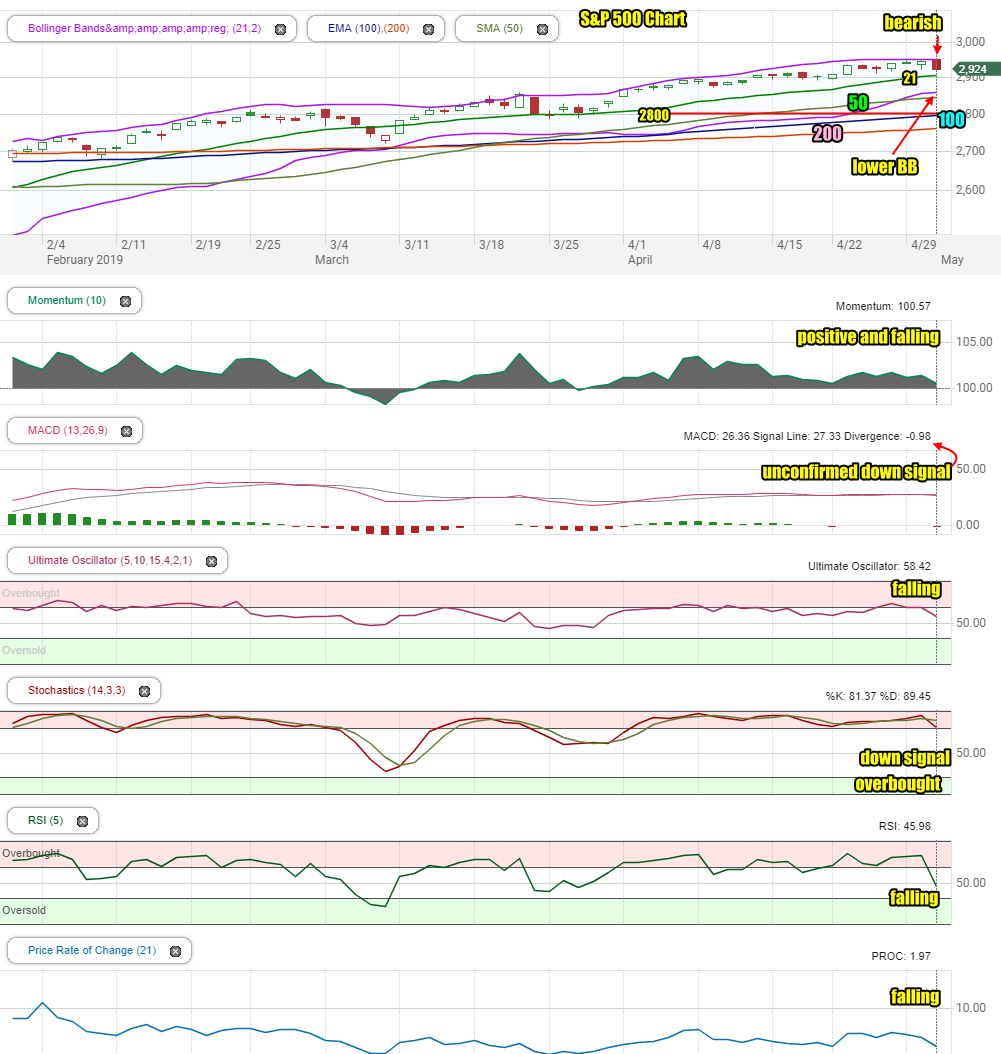
The S&P closed above the 21 day moving average on Wednesday but left behind a bearish candlestick for Thursday.
Note that the Lower Bollinger Band has moved still higher above the 50 day moving average and the Upper Bollinger Band is turning down as well. A new Bollinger Bands Squeeze seems likely which could be the pullback or dip for May which so many analysts are waiting for.
All major moving averages are moving ahead with the 50 day and 100 day both moving away from the 200 day. The 100 day is now at the 2800 level.
The index on Wednesday looks set to test at the very least, the 21 day moving average.
Stock Market Outlook review of Wed May 1 2019
Stock Market Outlook: Technical Indicators Review:
Momentum: Momentum is positive and falling.
- Settings: For momentum I use a 10 period when studying market direction.
MACD Histogram: MACD (Moving Averages Convergence / Divergence) issued an up signal on Tuesday April 2. On Wednesday MACD issued an unconfirmed sell or down signal.
- Settings: For MACD Histogram, I am using the Fast Points set at 13, Slow Points at 26 and Smoothing at 9.
Ultimate Oscillator: The Ultimate Oscillator signal is positive and falling.
- Settings: The Ultimate Oscillator settings are: Period 1 is 5, Period 2 is 10, Period 3 is 15, Factor 1 is 4, Factor 2 is 2 and Factor 3 is 1. These are not the default settings but are the settings I use with the S&P 500 chart set for 1 to 3 months.
Slow Stochastic: The Slow Stochastic has a strong down signal in place and is overbought.
- Settings: For the Slow Stochastic I use the K period of 14 and D period of 3. The Slow Stochastic tries to predict the market direction further out than just one day.
Relative Strength Index: The RSI signal is falling.
- Settings: The relative strength index is set for a period of 5 which gives it 5 days of market movement to monitor. It is often the first indicator to show an overbought or oversold signal.
Rate of Change: The rate of change signal is falling indicating lower prices lie ahead.
- Settings: Rate Of Change is set for a 21 period. This indicator looks back 21 days and compares price action from the past to the present. With the Rate Of Change, prices are rising when signals are positive. Conversely, prices are falling when signals are negative. As an advance rises the Rate Of Change signal should also rise higher, otherwise the rally is suspect. A decline should see the Rate Of Change fall into negative signals. The more negative the signals the stronger the decline.
Support Resistance Levels To Be Aware Of:
2950 is resistance
2900 is light support
2860 is light support
2830 is light support
2800 is strong support
2795 is light support
2745 to 2750 is light support
2725 is light support
2700 is light support
2675 is light support
2650 is support
2625 is light support
2600 is support.
There was good support at the 2550 level which is back to being support.
The 2500 level is support.
The S&P has light support at 2480 and better support at 2450.
There is good support at 2425.
Below that there is some support at 2400, 2380, 2350.
Stock Market Outlook for Tomorrow -Thu May 2 2019
For Thursday, investors may try to rally stocks after the drop on Wednesday, but normally this kind of drop needs more than a day to recover.
All the technical indicators took a hit on Wednesday, turning lower. MACD and the Slow Stochastic both issued down signals. MACD’s down signal needs confirmation before it becomes considered valid.
Thursday may see a lot of choppiness but investors may keep the market trading in a fairly tight range ahead of Friday’s unemployment numbers.
Overall Thursday looks set to test the 21 day moving average and probably close lower. This is not the end of the rally however, but a reactionary move by many investors. The chance that it will last is slim.
Stock Market Outlook Archives
Stock Market Outlook For Wed May 6 2026 – Choppy But Higher Still

Morning Investing Strategy Notes for Tue May 5 2026

Stock Market Outlook For Tue May 5 2026 – Overbought and Lower

Morning Investing Strategy Notes for Mon May 4 2026
Stock Market Outlook For Mon May 4 2026 – Dips Likely With Possible Lower Close

Morning Investing Strategy Notes for Fri May 1 2026
Stock Market Outlook For Fri May 1 2026 – Overbought But Higher

Morning Investing Strategy Notes for Thu Apr 30 2026
Stock Market Outlook For Thu Apr 30 2026 – Dips Likely Possible Lower Close
Morning Investing Strategy Notes for Wed Apr 29 2026
Stock Market Outlook For Wed Apr 29 2026 – Choppy But Higher Ahead Of More Earnings

Morning Investing Strategy Notes for Tue Apr 28 2026