
 Wednesday caught investors by surprise as an earnings disappointment from Target before the open, was seen as a signal that the “feared” recession, with high inflation, was closer than analysts are predicting. Target stock was crushed by 25% for its worst one day since October 19 1987 (which I was trading in). Retail stocks were literally smashed today. Walmart lost another 6.7% to close at $122.43, now down $26 dollars in two days. Costco fell $61 to lose 12.45% to close at $429.40. They report earnings next week. Lululemon Athletica fell $32.96 for a 10.7% loss despite excellent earnings and a strong outlook for the next quarter due out June 1. The selling was relentless and started at the open. It quickly spread to other stocks as the 4 day rally was lost by 1:00 PM, just 3.5 hours.
By the end of the day the SPX was down 165 points for a 4% plunge. This is the third large sell-off in May and the sixth large sell-off of 120 points or more since April. This is a definite signal of a market in trouble.
The NASDAQ lost 566 points for a 4.73% loss and the Dow lost 1164 points for a 3.57% loss.
The biggest problem Target and Walmart faced in their earnings report were the shrinking pricing margins as they struggle to pass along price increases to consumers. On Wednesday investors decided it was time to vacate the retail sector. As volumes rose more investors decided it was time to sell out of other positions as well. By the end of the day investors were just dumping shares in general.
Let’s review the closing technical indicators from Wednesday to see if stocks can mount a bounce or will sell lower on Thu May 19 2022.
Stock Market Outlook Chart Comments At The Close on Wed May 18 2022
The one technical aspect to keep in mind is that the SPX chart, just like the NASDAQ chart, has remained solidly bearish since April 8 but even before then, the outlook was weighted heavily to the downside since the start of the year.
On Tuesday for example, there were only two bullish signals, none of which were strong. On Wednesday there are no bullish signals other than the closing candlestick which is bearish but also points to a potential bounce, but one that will fail.
The Upper Bollinger Band is falling as is the Lower Bollinger Band.
All moving averages are bearish and there was a new sell signal on Monday May 16 as the 100 day moving average fell below the 200 day. That means the 200 day moving average is now leading the market. This is bearish and usually signals more selling to come.
All the major moving averages are falling including the 200 day. The 21 day is still falling rapidly.
The chart is 100% bearish for Thursday. Often that means a bit of a morning bounce before moving lower later in the day.

Stock Market Outlook review of Wed May 18 2022
Stock Market Outlook: Technical Indicators Review:
Momentum: Momentum is falling sharply and negative. With momentum strongly negative any bounce is not going to hold.
- Settings: For momentum I use a 10 period when studying market direction.
MACD Histogram: MACD (Moving Averages Convergence / Divergence) issued a down signal Friday April 8. On Wednesday the down signal gained to the bearish side as did the MACD histogram. It was not a large move down but enough to warn that we could see further selling on Thursday and Friday.
- Settings: For MACD Histogram, I am using the Fast Points set at 13, Slow Points at 26 and Smoothing at 9.
Ultimate Oscillator: The Ultimate Oscillator is falling and back negative.
- Settings: The Ultimate Oscillator settings are: Period 1 is 5, Period 2 is 10, Period 3 is 15, Factor 1 is 4, Factor 2 is 2 and Factor 3 is 1. These are not the default settings but are the settings I use with the S&P 500 chart set for 1 to 3 months.
Slow Stochastic: The Slow Stochastic has a down signal in place and is no longer oversold.
Settings: For the Slow Stochastic I use the K period of 14 and D period of 3. The Slow Stochastic tries to predict the market direction further out than just one day.
Relative Strength Index: The RSI signal is falling sharply and is no longer oversold.
- Settings: The relative strength index is set for a period of 5 which gives it 5 days of market movement to monitor. It is often the first indicator to show an overbought or oversold signal.
Rate of Change: The rate of change signal is falling sharply.
- Settings: Rate Of Change is set for a 21 period. This indicator looks back 21 days and compares price action from the past to the present. With the Rate Of Change, prices are rising when signals are positive. Conversely, prices are falling when signals are negative. As an advance rises the Rate Of Change signal should also rise higher, otherwise the rally is suspect. A decline should see the Rate Of Change fall into negative signals. The more negative the signals the stronger the decline.
Support and Resistance Levels To Be Aware Of:
4400 is resistance
4370 is light support
4350 is light resistance
4300 is light resistance
4290 is light resistance
4270 is light resistance
4250 is resistance
4225 is light resistance
4200 is light resistance
4150 is light resistance
4100 is light support
4050 is light support
4025 is light support
4000 is good support
3975 is light support and is a decline of 17.5%
3900 is light support and is a decline of 19%
3850 is good support and is a decline of 20%
3600 is good support at is a decline of 25%
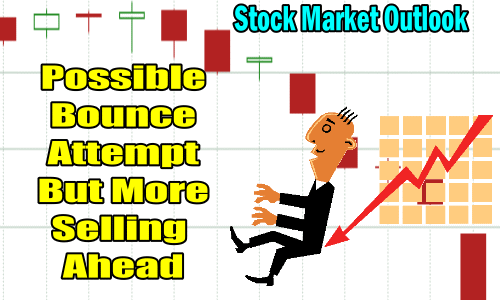
Stock Market Outlook for Tomorrow – Thu May 19 2022
The technical indicators at the close on Wednesday are strongly bearish. Often this signals a chance for a bounce, but after the strong selling, no bounce can hold immediately.
On any bounce higher, I will be taking profits on positions and preparing for more downside where I can setup further trades. I will be setting up another SPY put trade on Thursday. This trade is explained in more detail in the members morning Investing Strategy Notes.
The Index is on the verge of retesting the correction sell-off lows down at 3860. It won’t take much to see the index fall that low and break lower. New lows are coming for the current sell-off, whether on Thursday or Friday or next week. The gains made from Friday last week have all been lost. It is a rare market that can immediately recover from this type of sell-off. Time is needed to rebuild the technical indicators. It is easier to do that from a lower point than from a bounce. This is why any bounce has little chance of success at present.
Just for interest, the collapse on Wednesday in Target Stock (TGT), has left the stock at an 11.5 times PE, 10.6 times price to cash flow and an annual dividend of $3.60 for a 2.23% yield. If the stock moves lower over the next couple of weeks, it will be even more attractive at some point for a trade.
Potential Market Moving Events
On Wednesday housing starts were slightly lower at 1.72 million and building permits were also slightly lower at 1.82 million. These though do not indicate the housing market is slowing. The numbers have to decline a lot further to suggest a slowdown is coming to housing.
Thursday:
8:30 Weekly Initial Unemployment Insurance Claims
10:00 Existing Home Sales – 5.77 million prior. A higher number will show the economy is expanding.
Friday:
No market moving reports
Stock Market Outlook Archives
Stock Market Outlook For Wed May 6 2026 – Choppy But Higher Still

Morning Investing Strategy Notes for Tue May 5 2026

Stock Market Outlook For Tue May 5 2026 – Overbought and Lower

Morning Investing Strategy Notes for Mon May 4 2026
Stock Market Outlook For Mon May 4 2026 – Dips Likely With Possible Lower Close

Morning Investing Strategy Notes for Fri May 1 2026
Stock Market Outlook For Fri May 1 2026 – Overbought But Higher

Morning Investing Strategy Notes for Thu Apr 30 2026
Stock Market Outlook For Thu Apr 30 2026 – Dips Likely Possible Lower Close
Morning Investing Strategy Notes for Wed Apr 29 2026
Stock Market Outlook For Wed Apr 29 2026 – Choppy But Higher Ahead Of More Earnings

Morning Investing Strategy Notes for Tue Apr 28 2026