
 Prior Trading Day Summary:
On Wednesday analysts were surprised by the GDP contracting 0.3% annualized for the first quarter which was in stark contrast to the prior 2.4% GDP growth at the end of 2024. As well, the ADP employment report showed just 62,000 jobs versus the 120,000 estimated versus 147,000 prior. Stocks opened a lot lower with the SPX down at 5433 as investors reacted to the news. That though proved to be the end of the sell-off and from there investors moved back into stocks.
The SPX closed out the day down 35 points, well off the morning plunge, to close at 5525. The NASDAQ had fallen to 16959 early morning but the close saw the index down 161 points to close at 17483. It was a dramatic turnaround as investors decided to focus more on earnings than on economic numbers at the moment.
For the month of April 2025, the SPX lost 86 points and the NASDAQ was fkat, ganing 1 point in what was a tumultuous month.
A loss in April for the indexes is not common and April usually is the final month of what is considered the text 6 moths of the year. As we enter May, we are reminded of the saying “Sell in May and go away”. We will have to see if that holds true to the year as we start what is usually the worse 6 months of the trading year.
Let’s review the technical indicators from the close on Wed Apr 30 2025 to see what we should expect for Thu May 1 2025, the first trading day of May.
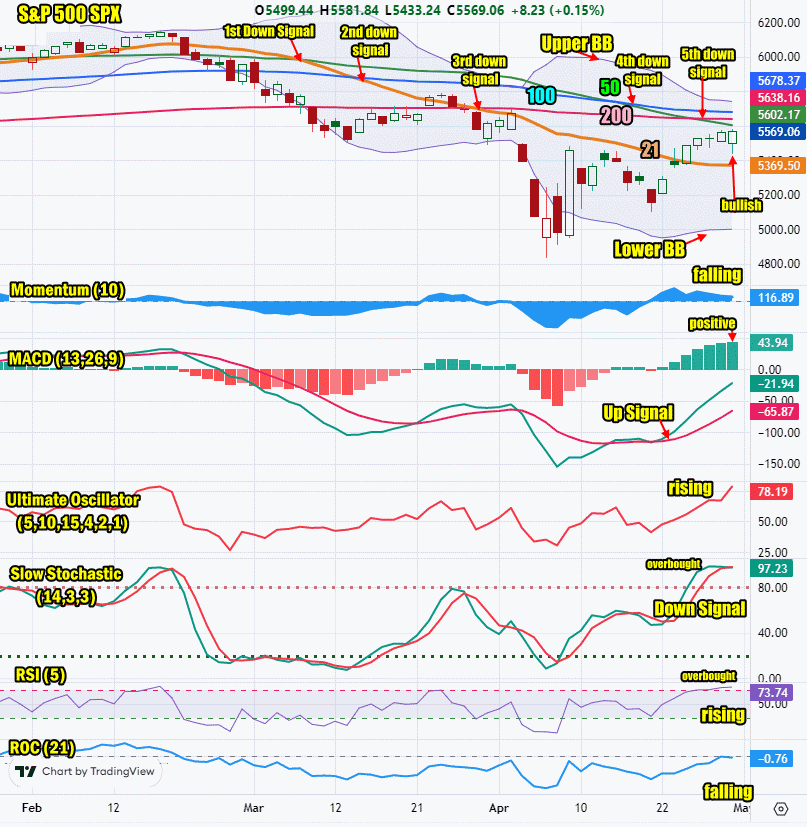
Stock Market Outlook: SPX Closing Chart For Wed Apr 30 2025
The index closed above the 21 day but below the 200 day moving average again. This is bearish.
The closing candlestick is bullish but with a long shadow, Often this shadow signals some weakness should be expected on the following day, but a higher close is more common.
The 21 day moving average is falling and closed at 5369. The 21 day moving average fell below the 50 day on Friday Mar 7. It fell below the 100 day on Thursday Mar 13 for a second down signal and on Friday Mar 28 it fell below the 200 day for a third down signal. Note that the 21 day decline is slowing. This is a sign the downtrend could be ending.
The 50 day moving average is falling and closed at 5602 which is bearish. The 50 day moving average fell below the 100 day on Tue April 15. which issued a 4th down signal on the SPX. The 50 day on Friday fell below the 200 day for a 5th down signal.
The 100 day moving average is falling and closed at 5678 which is bearish.
The 200 day moving average is unchanged and closed at 5638 which is bearish. The decline in the 200 day is stalled.
All of the moving averages are either continuing their decline or stalled, but two continue to indicate we could see the sell-off end shortly.
The Lower Bollinger Band is turning sideways which is bearish to neutral. The Upper Bollinger Band is also turning sideways. This could be a signal the market could become range bound for a few days. We will know more Thursday.
For Thursday the SPX chart is bearish but with the closing candlestick pointing to a higher close.
SPX Stock Market Outlook review of Wed Apr 30 2025
Stock Market Outlook: Technical Indicators Review
Momentum: Momentum is falling and positive.
|
MACD Histogram: MACD (Moving Averages Convergence / Divergence) issued an up signal on Tue Apr 22 2025. On Wed Apr 30 2025 the up signal was stronger.
|
Ultimate Oscillator: The Ultimate Oscillator is rising and positive.
|
Slow Stochastic: The Slow Stochastic is overbought and issued a weak down signal at the close on Wednesday.
|
Relative Strength Index: The RSI signal is rising and overbought.
|
| Rate of Change: The rate of change signal is rising and indicating a higher day is likely for Thursday. Settings: Rate Of Change is set for a 21 period. This indicator looks back 21 days and compares price action from the past to the present. With the Rate Of Change, prices are rising when signals are positive. Conversely, prices are falling when signals are negative. As an advance rises, the Rate Of Change signal should also rise higher, otherwise the rally is suspect. A decline should see the Rate Of Change fall into negative signals. The more negative the signals the stronger the decline. |
Stock Market Outlook: Support and Resistance Levels |
| 5700 is resistance |
| 5650 is resistance |
| 5630 is resistance |
| 5600 is resistance |
| 5550 is resistance |
| 5500 is resistance |
| 5450 is resistance |
| 5400 is resistance |
| 5350 is support |
| 5300 is support |
| 5230 is support |
| 5000 is support |
| 4770 is support |
| 4680 is support |
| 4500 is support |
| 4365 is support |
| 4150 is support |
| 4000 is support |
Stock Market Outlook for Thu May 1 2025
At the close on Wednesday, the 5350 turned back to support for the rally. After the close on Wednesday big tech stocks Microsoft, META and Qualcomm rose as they reported better than expected earnings. This is sure to assist the indexes in opening higher.
At present investors seem willing to brush aside the weak economic reports. If however future reports continue to support the outlook of a recession, stocks will eventually move lower. That though is in the future. For Thu May 1 2025, the technical indicators are advising that the bulls are going to push stocks up on Thursday, as a higher open is expected followed by some weakness and then ending with a higher close.
Potential Economic and Political Market Moving Events
Monday:
No reports
Tuesday:
8:30 Advanced trade balance in goods surprised analysts with a jump to $162.0 billion.
8:30 Advanced retail inventories were unchanged at -0.1%
8:30 Advanced wholesale inventories were unchanged at 0.5%
9:00 S&P Case-Shiller home price index was lower than estimated, at 4.5%
10:00 Consumer confidence slipped to 86 from 93.9
10:00 Job openings fell to 7.2 million from 7.5 million prior
Wedneday:
8:15 ADP employment numbers fell to just 62,000 from 124,000 prior
8:30 GDP plunged to 0.3% annualized from 2.4% prior
8:30 Personal income was higher at 0.5% than estimated but below 0.8% prior
8:30 Employment cost index was unchanged at 0.9%
9:45 Chicago Business Barometer (PMI) dropped further than estimated to 44.6 from 47.6 prior
10:00 Consumer spending is rose more than expected to 0.7% from 0.4% prior
10:00 Personal Consumption Expenditures (PCE) index dropped to 0.0% from 0.3% prior
10:00 PCE year-over-year dropped to 2.3% from 2.5% prior
10:00 Core PCE index dropped to 0.0% from 0.4% prior
10:00 Core PCE year-over-year fell to 2.6% from 2.8% prior
10:00 Pending home sales jumped 6.1% from 2.1% prior
Most of the economic reports on Wednesday point to continued weakness or growing weakness.
Thursday:
8:30 Weekly Initial Unemployment Insurance Claims are expected to rise to 225,000 from 222,000 prior
9:45 S&P final manufacturing PMI is expected to slip slightly to 50.6 from 50.7 prior
10:00 ISM manufacturing is estimated to slip to 47.8% from 49.0%
10:00 Construction spending is estimated to drop to 0.2% from 0.7% prior
Intraday Auto sales are estimated to total 17. million down 200,000