FullyInformed.com

Stock Market Outlook for Thu Mar 8 2018 – Sideways Bias Up

Mar 7, 2018 | Stock Market Outlook


Stock Market Outlook - sideways but still up

What Happened Wed Mar 7 2018

Wednesday markets opened lower on concerns over the resignation of Gary Cohn, top economic advisor in the Trump administration. Overnight the futures had pointed to a strong gap down opening. Markets did open lower, rallied and then retested the lows over the lunch hour.  When the retest held the S&P above 2700, buyers flocked in and the S&P moved higher turning positive near the closing and then slipping to end the day slightly negative. The Dow was down modestly while the NASDAQ recovered all its losses and ended positive on the day.


Closing Statistics for Wed Mar 7 2018 

S&P 500 Index Close

The S&P index ended down 1.32- to 2,726.80

Dow Jones Index Close

The Dow Jones ended down 82.76 to 24,801.36

NASDAQ Index Close

The NASDAQ closed up 24.64 to 7,396.65


Stock Market Outlook – Review of Wed Mar 7 2018 

Chart Comments At The Close:

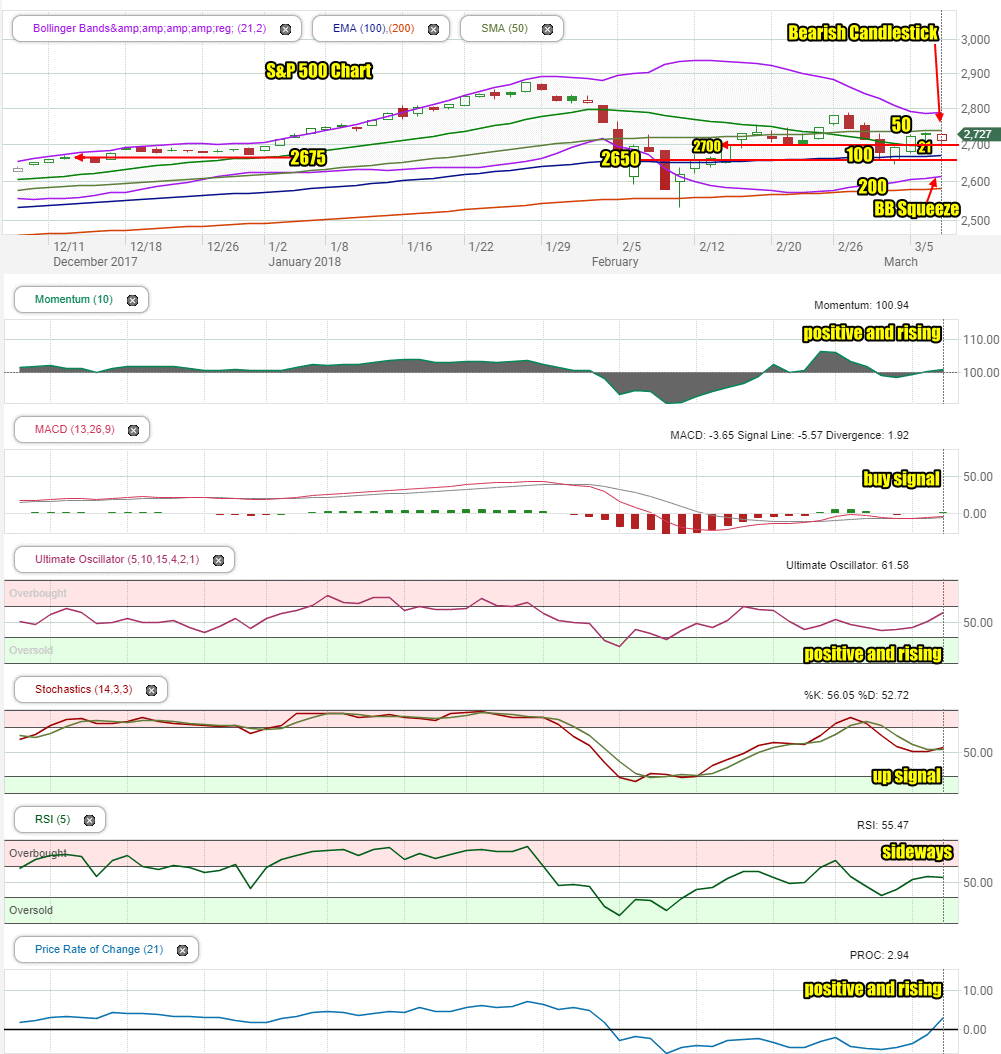
The chart continues to point to the S&P remaining range bound rather than a rest of the early Feb lows or the lows of Mar 2.

The SPX on Wednesday bounced off the 21 day moving average and closed below the 50 day after almost reaching it toward the end of the day. It left behind a bearish candlestick for Thursday.

The 21 day moving average is continuing to fall. The 50 day moving average is starting to turn lower while the 100 day and 200 day are still climbing.

A Bollinger Bands Squeeze is forming which might be seen by the end of this week. The Bollinger Bands Squeeze may end up with the SPX moving higher.

Overall the chart is still fairly bullish for Thursday following the morning drop on Wednesday which was recovered.

Stock Market Outlook review of Wed Mar 7 2018

Stock Market Outlook: Technical Indicators:

Technical indicators are turning back bullish after Wednesday’s dramatic recovery of the morning sell-off.

Momentum: For momentum I use a 10 period when studying market direction. Momentum is positive and rising.

MACD Histogram: For MACD Histogram, I am using the Fast Points set at 13, Slow Points at 26 and Smoothing at 9. MACD (Moving Averages Convergence / Divergence) issued a buy signal on March 5. The buy signal is gathering strength at today’s close.

Ultimate Oscillator: The Ultimate Oscillator settings are: Period 1 is 5, Period 2 is 10, Period 3 is 15, Factor 1 is 4, Factor 2 is 2 and Factor 3 is 1. These are not the default settings but are the settings I use with the S&P 500 chart set for 1 to 3 months. The Ultimate Oscillator signal is positive and rising.

Slow Stochastic: For the Slow Stochastic I use the K period of 14 and D period of 3. The Slow Stochastic tries to predict the market direction further out than just one day. The Slow Stochastic has an up signal in place.

Relative Strength Index: The relative strength index is set for a period of 5 which gives it 5 days of market movement to monitor.  It often is the first indicator to show an overbought or oversold signal.  The RSI signal is moving sideways.

Rate of Change: Rate Of Change is set for a 21 period. This indicator looks back 21 days and compares price action from the past to the present. With the Rate Of Change prices are rising when signals are positive. Conversely, prices are falling when signals are negative. As an advance rises the Rate Of Change signal should also rise higher, otherwise the rally is suspect. A decline should see the Rate Of Change fall into negative signals. The more negative the signals the stronger the decline. The rate of change is positive and rising indicating higher prices are expected.


Support Levels To Be Aware Of:

2700 is good support.

2675 is light support.

2650 is light support and 2620 is also light support.

There is good support at the 2550 level from where the market bounced back from the recent correction.

The S&P has light support at 2480. It also has light support at 2450 and good support at 2425. Below that there is some support at 2400, 2380, 2350. 2300 has the most support at present but would represent a full correction as a drop to this level would be 20% and just 5% away from a potential bear market signal.


 Stock Market Outlook for Tomorrow – Thu Mar 8 2018

Technical indicators tonight are biased to the positive side of the market.

The Slow Stochastic and MACD are both holding buy signals or up signals that are gathering strength.

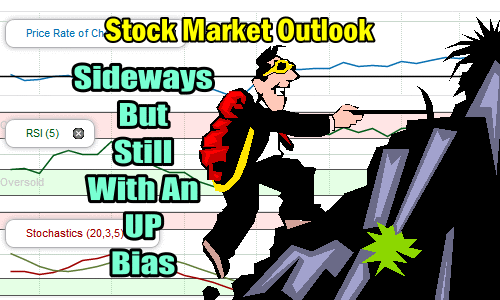
Overall there will be dips and possibly even a drop on Thursday down to 2710 but the market is holding a sideways outlook with a bias to close higher on Thursday.


 Market Direction Internal Links

Profiting From Understanding Market Direction (Articles Index)

How I Use Market Timing

How I Use Market Timing

Understanding Short-Term Signals

Various Market Timing Systems

Market Direction Portfolio Trades (Members)

Market Direction External Links

Market Direction

IWM ETF Russell 2000 Fund Info

Market Direction SPY ETF 500 Fund Info


Search

Select to view all results...

Generic selectors
Exact matches only
Search in title
Search in content
Post Type Selectors

Recent Outlooks

Stock Market Outlook for Fri May 3 2024 – All About The April Non-Farm Payroll Report

Prior Trading Day Summary: On Thursday investors pushed stocks higher for the second time this week, ahead of Friday’s April jobs report. The S&P gained gained 45 points to close at 5064. The NASDAQ rose 235 points to end the …

Morning Investing Strategy Notes for Thu May 2 2024

For FullyInformed Members the morning Investing Strategy Notes for Thu May 2 2024 discuss the FOMC interest rate decision and Fed’s news conference. There are a large number of trades outlined for today. These include Qualcomm Stock (QCOM), DoorDash Stock …

Stock Market Outlook for Thu May 2 2024 – Potential Bounce But Lower

Prior Trading Day Summary: On Wednesday investors moved stocks higher during the Fed’s news conference but then sold those same stocks lower in the final half hour in a wild day of volatility. Trading volumes were above average and the …

Morning Investing Strategy Notes for Wed May 1 2024

For FullyInformed Members the morning Investing Strategy Notes for Wed May 1 2024 discuss the outlook for the start of May. There are a large number of trades outlined for today. These include Amazon.com Stock (AMZN), Advanced Micro Devices Stock …

Stock Market Outlook for Wed May 1 2024 – Bounce But Lower – Fed Interest Rate Decision

Prior Trading Day Summary: Tuesday saw stocks tumble as investors decided to take profits from the recent rally. Economic reports on Tuesday did not favor the Fed cutting interest rates in May or probably even June. That also weighed on …

Morning Investing Strategy Notes for Tue Apr 30 2024

For FullyInformed Members the morning Investing Strategy Notes for Tue Apr 30 2024 discuss the outlook for the final trading day of the month and the start of May. There are a large number of trades outlined for today. These …

Stock Market Outlook for Tue Apr 30 2024 – Dips Likely – Flat To Higher Close

Prior Trading Day Summary: Monday saw the index trade choppily in a sideways trend until the final hour when the SPX dipped down below 5100 but then found buyers and closed back above it at 5116. The NASDAQ rose 55 …

Morning Investing Strategy Notes for Mon Apr 29 2024

For FullyInformed Members the morning Investing Strategy Notes for Mon Apr 29 2024 discuss the outlook for the final week of April. There are a large number of trades outlined for today. These include McDonalds Stock (MCD), NXP Semiconductor Stock …

Stock Market Outlook for Mon Apr 29 2024 – Some Weakness But Higher

Prior Trading Day Summary: Friday saw investors continue the rally despite the PCE number showing far more weakness than expected. The rally on Friday though saw lower volumes which could start the final week of April with a bit of …

Morning Investing Strategy Notes for Fri Apr 26 2024

For FullyInformed Members the morning Investing Strategy Notes for Fri Apr 26 2024 discuss the outlook following the surprisingly low GDP and strong earnings from Microsoft, Alphabet and others on Thursday after the close. There are a large number of …

Stock Market Outlook for Fri Apr 26 2024 – Higher and Positive Close

Prior Trading Day Summary: Thursday’s GDP number came in much lower than expected at 1.6%. This stunned analysts and investors and the market plunged at the start of the day. However buyers took advantage of the plunge and snapped up …

Morning Investing Strategy Notes for Thu Apr 25 2024

For FullyInformed Members the morning Investing Strategy Notes for Thu Apr 25 2024 discuss the expected sell-off and weakness after the recent bounce in equities. There are a large number of trades outlined for today. These include Tesla Stock (TSLA), …

Stock Market Outlook for Thu Apr 25 2024 – Weakness and Lower

Prior Trading Day Summary: Wednesday saw the rally stall. With the rally stalling investors took profits which weighed on stocks. The close saw the SPX up just 1 point at 5071 and the NASDAQ higher by 16 points to 15,712 …

Morning Investing Strategy Notes for Wed Apr 24 2024

For FullyInformed Members the morning Investing Strategy Notes for Wed Apr 24 2024 discuss the second bounce on Tuesday and the outlook for the remainder of the week. There are a large number of trades outlined for today. These include …