

For Wednesday March 6, stocks continued weak and closed lower on all 3 indexes as investors continue to remain concerned over a potential trade arrangement between China and the USA. Wednesday was the third consecutive day of losses.
Stock Market Outlook Chart Comments At The Close on Wed Mar 6 2019
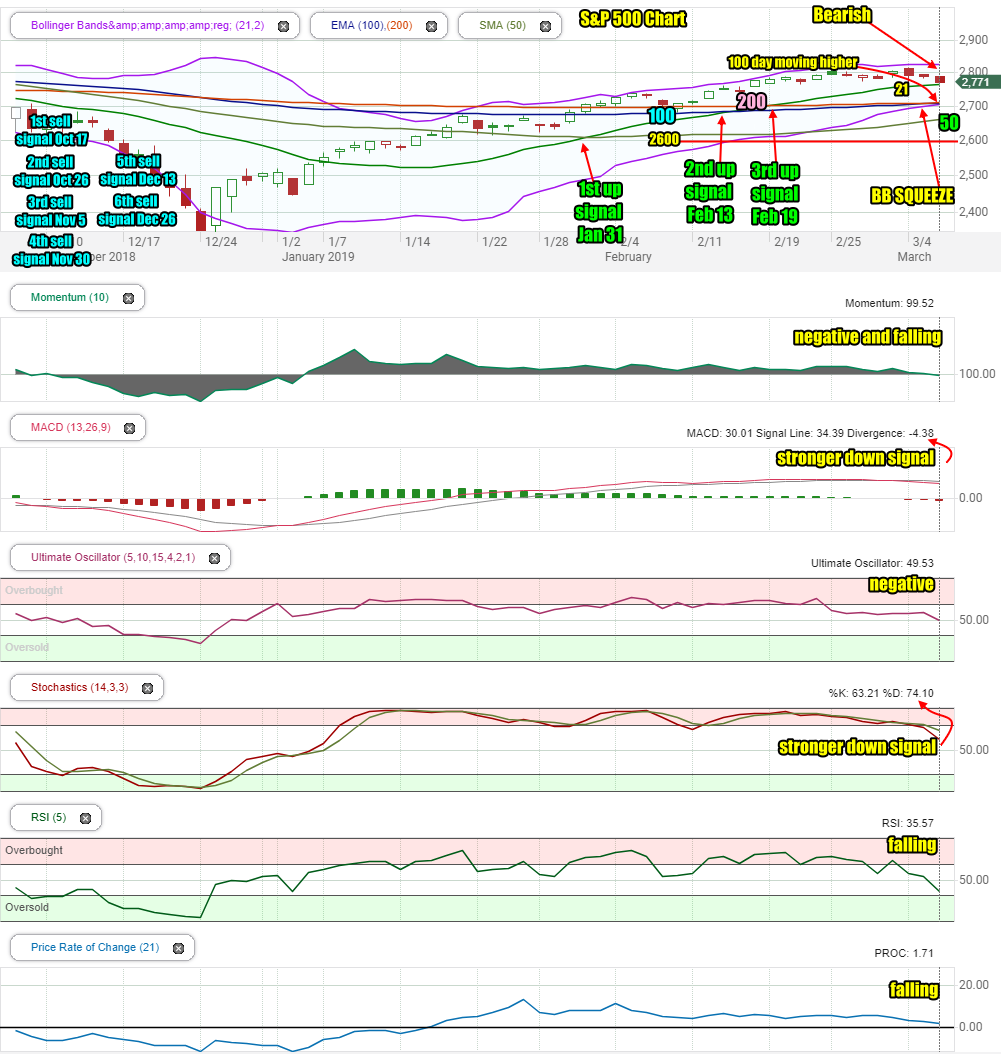
Wednesday saw the index close below 2800 once again. During the day the index slipped below the 21 day moving average but bounced back to close just slightly above it.
The closing candlestick was bearish for Thursday. The 100 day moving average is on top of the 200 day and ready to move above it. This will be a major up signal when it occurs. The 50 day moving average is still trying to climb.
Meanwhile the Upper Bollinger Band is falling and the Lower Bollinger Band is rising in what is a Bollinger Bands Squeeze. This will send stocks higher or lower, but if the squeeze occurs there will be a change in direction.
There are still 3 up signals in place and 6 down signals. The down signals will begin to be dropped as the moving averages recover to their correct positions with the 21 day on top and the 50 day leading the 100 and 200 day moving averages. The 100 day moving average is trading below the 200 day and could cross above it at any time. This would be a major up signal if it occurs.
The 2600 level has anchored the rally since January 14. The 2700 level has been held for the entire month of February. Both of these are bullish signs.
Today stocks stayed above Monday’s intraday low which is a bullish sign, although as members know, the Market Breadth Indicators are becoming a bit more concerning as they weaken.
Stock Market Outlook review of Wed Mar 6 2019
Stock Market Outlook: Technical Indicators Review:
Momentum: Momentum is negative and falling.
- Settings: For momentum I use a 10 period when studying market direction.
MACD Histogram: MACD (Moving Averages Convergence / Divergence) issued a down signal on Thursday February 28 2019. The sell signal was stronger on Wednesday Mar 6.
- Settings: For MACD Histogram, I am using the Fast Points set at 13, Slow Points at 26 and Smoothing at 9.
Ultimate Oscillator: The Ultimate Oscillator signal is moving lower and has turned negative.
- Settings: The Ultimate Oscillator settings are: Period 1 is 5, Period 2 is 10, Period 3 is 15, Factor 1 is 4, Factor 2 is 2 and Factor 3 is 1. These are not the default settings but are the settings I use with the S&P 500 chart set for 1 to 3 months.
Slow Stochastic: The Slow Stochastic has a down signal in place for Thursday and is no longer overbought.
- Settings: For the Slow Stochastic I use the K period of 14 and D period of 3. The Slow Stochastic tries to predict the market direction further out than just one day.
Relative Strength Index: The RSI signal is falling further.
- Settings: The relative strength index is set for a period of 5 which gives it 5 days of market movement to monitor. It is often the first indicator to show an overbought or oversold signal.
Rate of Change: The rate of change signal is falling indicating that prices will be moving lower.
- Settings: Rate Of Change is set for a 21 period. This indicator looks back 21 days and compares price action from the past to the present. With the Rate Of Change, prices are rising when signals are positive. Conversely, prices are falling when signals are negative. As an advance rises the Rate Of Change signal should also rise higher, otherwise the rally is suspect. A decline should see the Rate Of Change fall into negative signals. The more negative the signals the stronger the decline.
Support Resistance Levels To Be Aware Of:
2900 was support – this will be strong resistance
2860 was support – this will be resistance
2830 was light support and will be light resistance
2800 is strong resistance
2795 is light resistance
2745 to 2750 is light support
2725 is light support
2700 is light support
2675 is light support
2650 is support
2625 is light support
2600 is support.
There was good support at the 2550 level which is back to being support.
The 2500 level is support.
The S&P has light support at 2480 and better support at 2450.
There is good support at 2425.
Below that there is some support at 2400, 2380, 2350.
2300 has the most support at present but would represent a full correction of 641 points as a drop to this level would be 21% and just 5% away from a full bear market signal ending the bull market from 2009.
Stock Market Outlook for Tomorrow – Thu Mar 7 2019
For Thursday stocks are set to move lower into the close.
The technical indicators are negative signaling lower prices are ahead. There are no indicators pointing to a higher market for Thursday. Stocks will end the day lower.
Stock Market Outlook Archives
Stock Market Outlook For Wed May 6 2026 – Choppy But Higher Still

Morning Investing Strategy Notes for Tue May 5 2026

Stock Market Outlook For Tue May 5 2026 – Overbought and Lower

Morning Investing Strategy Notes for Mon May 4 2026
Stock Market Outlook For Mon May 4 2026 – Dips Likely With Possible Lower Close

Morning Investing Strategy Notes for Fri May 1 2026
Stock Market Outlook For Fri May 1 2026 – Overbought But Higher

Morning Investing Strategy Notes for Thu Apr 30 2026
Stock Market Outlook For Thu Apr 30 2026 – Dips Likely Possible Lower Close
Morning Investing Strategy Notes for Wed Apr 29 2026
Stock Market Outlook For Wed Apr 29 2026 – Choppy But Higher Ahead Of More Earnings

Morning Investing Strategy Notes for Tue Apr 28 2026