

On Wednesday we saw the expected bounce and then the expected lower close.
What was interesting was the lack of concern as measured by the VIX which rose just $0.90 to $21.20, a rise of 4.4% and still among the lower readings for 2021.
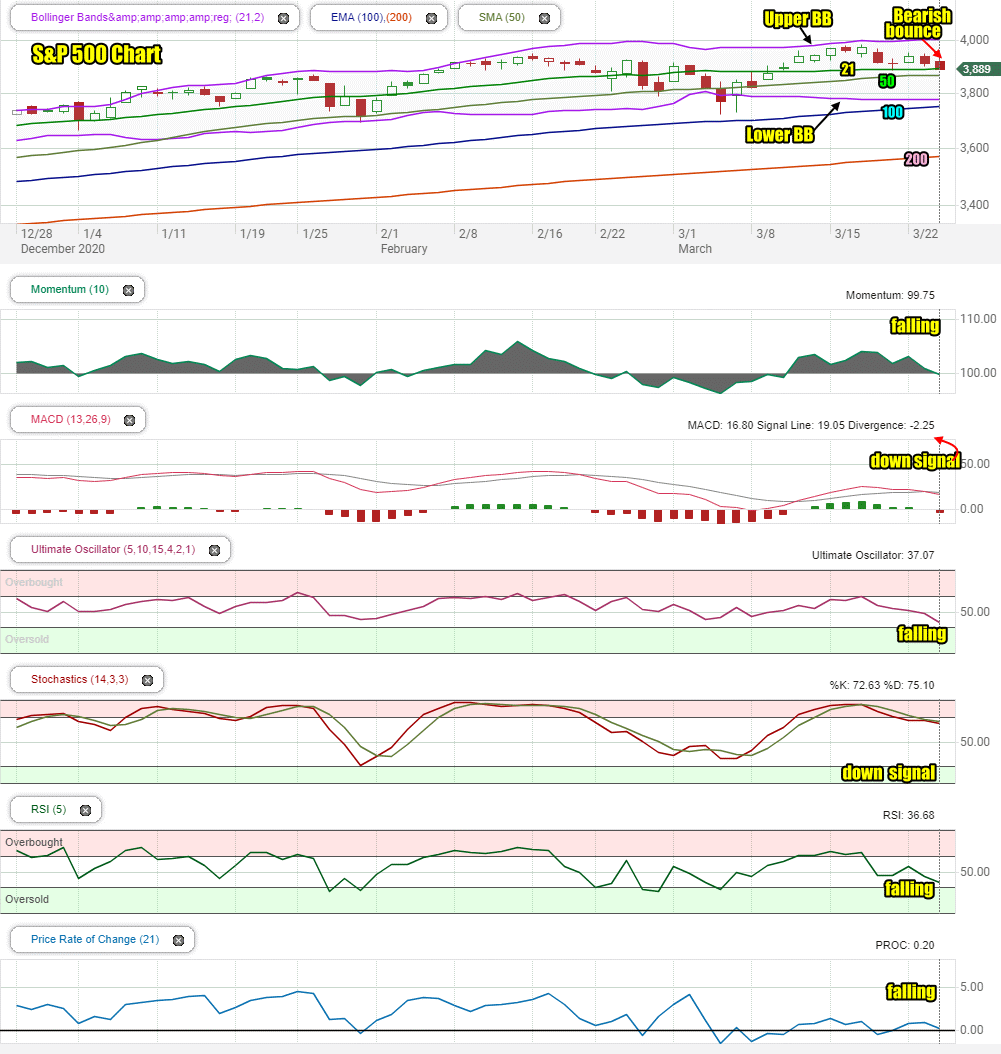
The S&P closed down 21 points to 3889, just below the 3900 support level.
Let’s review the technical analysis to see what they predict for Thu Mar 25 2021.
Stock Market Outlook Chart Comments At The Close on Wed Mar 24 2021
The Upper Bollinger Band is still not moving higher but instead is trending sideways which is a bit bearish. The Lower Bollinger Band which was falling is starting to turn back up. If it rises to the 50 day it will be bearish.
The index closed at the 21 day moving average which almost always will see a bounce even if it does not last. It closed at the lowest level since March 9.
The 21 day is still trying to rise while the 50 day is dipping lower. Neither is bullish.
The closing candlestick on Wednesday is bearish for Thursday
The 100 and 200 day moving averages are all climbing higher. A close below the 21 day on Thursday or Friday for the SPX would be bearish.
Stock Market Outlook review of Wed Mar 24 2021
Stock Market Outlook: Technical Indicators Review:
Momentum: Momentum is falling and negative.
- Settings: For momentum I use a 10 period when studying market direction.
MACD Histogram: MACD (Moving Averages Convergence / Divergence) issued an up signal on Thursday March 11 2021. On Wednesday an unconfirmed down signal was issued.
- Settings: For MACD Histogram, I am using the Fast Points set at 13, Slow Points at 26 and Smoothing at 9.
Ultimate Oscillator: The Ultimate Oscillator is falling.
- Settings: The Ultimate Oscillator settings are: Period 1 is 5, Period 2 is 10, Period 3 is 15, Factor 1 is 4, Factor 2 is 2 and Factor 3 is 1. These are not the default settings but are the settings I use with the S&P 500 chart set for 1 to 3 months.
Slow Stochastic: The Slow Stochastic has a down signal in place for a fifth day.
Settings: For the Slow Stochastic I use the K period of 14 and D period of 3. The Slow Stochastic tries to predict the market direction further out than just one day.
Relative Strength Index: The RSI signal is falling.
- Settings: The relative strength index is set for a period of 5 which gives it 5 days of market movement to monitor. It is often the first indicator to show an overbought or oversold signal.
Rate of Change: The rate of change signal is falling.
- Settings: Rate Of Change is set for a 21 period. This indicator looks back 21 days and compares price action from the past to the present. With the Rate Of Change, prices are rising when signals are positive. Conversely, prices are falling when signals are negative. As an advance rises the Rate Of Change signal should also rise higher, otherwise the rally is suspect. A decline should see the Rate Of Change fall into negative signals. The more negative the signals the stronger the decline.
Support and Resistance Levels To Be Aware Of:
4000 is resistance
3900 is support
3850 is support
3800 is support
3750 is good support and the 100 day is at this level
3700 is light support
3680 is light support – The 100 day moving average is at this valuation.
3600 is strong support
3550 is support – The 200 day is at this level. A drop this low would be a 10% correction.
3500 is strong support
3450 is support
Stock Market Outlook for Tomorrow – Thu Mar 25 2021
For Thursday, the technical indicators are all pointing lower. Almost always we will see a bounce when al the indicators are pointing down. As well the index closed at the 21 day moving average.
For Thursday we should see some weakness at the open and then a bounce attempt that should fail.
On Thursday there is another strong possibility of a lower close as MACD issued a new unconfirmed down signal on Wednesday.
Stock Market Outlook Archives
Stock Market Outlook For Wed May 6 2026 – Choppy But Higher Still

Morning Investing Strategy Notes for Tue May 5 2026

Stock Market Outlook For Tue May 5 2026 – Overbought and Lower

Morning Investing Strategy Notes for Mon May 4 2026
Stock Market Outlook For Mon May 4 2026 – Dips Likely With Possible Lower Close

Morning Investing Strategy Notes for Fri May 1 2026
Stock Market Outlook For Fri May 1 2026 – Overbought But Higher

Morning Investing Strategy Notes for Thu Apr 30 2026
Stock Market Outlook For Thu Apr 30 2026 – Dips Likely Possible Lower Close
Morning Investing Strategy Notes for Wed Apr 29 2026
Stock Market Outlook For Wed Apr 29 2026 – Choppy But Higher Ahead Of More Earnings

Morning Investing Strategy Notes for Tue Apr 28 2026