
On Wednesday with the 10 year Treasury moving back above 3%, investors turned their attention back to all the recession warnings. Many analysts are warning investors that earnings will move lower as we head into the second half of 2022. That drop in earnings, they saw, will also drop the SPX to 3900 or even as low as 3700.
With those concerns focused on by investors, the S&P lost 1% and ended the day at 4115.
The NASDAQ closed down three-quarters of a percent lower to close at 12086. The selling on Wednesday did not wipe out the gains made on Tuesday.
Let’s review the closing technical indicators from Wednesday to see if stocks will attempt another bounce on Thursday, the day before we get the latest inflation numbers.
Stock Market Outlook Chart Comments At The Close on Wed Jun 8 2022
On Wednesday the closing candlestick is bearish.
The Upper Bollinger Band is moving higher and could push back above the 100 day moving average shortly. The Lower Bollinger Band is still trending sideways. Both are bullish signals at this time.
There is a trend change notification from the 21 day moving average which is turning higher and the Upper Bollinger Band climbing. Both are bullish.
The 200, 100 and 50 day moving averages are all falling lower and the 200 day is leading the market. This is bearish.
There are 4 down signals still in place.
The chart is 70% bearish for Wednesday. Continue keeping an eye on the 21 day moving average. Any close below it by the SPX will be a negative signal.

Stock Market Outlook review of Wed Jun 8 2022
Stock Market Outlook: Technical Indicators Review:
Momentum: Momentum is falling but in general it is trending sideways and still positive.
- Settings: For momentum I use a 10 period when studying market direction.
MACD Histogram: MACD (Moving Averages Convergence / Divergence) issued an up signal on Wed May 25 2022. On Wednesday MACD lost more strength. The MACD histogram also lost strength which you can see in the chart.
- Settings: For MACD Histogram, I am using the Fast Points set at 13, Slow Points at 26 and Smoothing at 9.
Ultimate Oscillator: The Ultimate Oscillator is unchanged.
- Settings: The Ultimate Oscillator settings are: Period 1 is 5, Period 2 is 10, Period 3 is 15, Factor 1 is 4, Factor 2 is 2 and Factor 3 is 1. These are not the default settings but are the settings I use with the S&P 500 chart set for 1 to 3 months.
Slow Stochastic: The Slow Stochastic has a neutral signal in place and is overbought.
Settings: For the Slow Stochastic I use the K period of 14 and D period of 3. The Slow Stochastic tries to predict the market direction further out than just one day.
Relative Strength Index: The RSI signal is falling.
- Settings: The relative strength index is set for a period of 5 which gives it 5 days of market movement to monitor. It is often the first indicator to show an overbought or oversold signal.
Rate of Change: The rate of change signal is rising and still positive.
- Settings: Rate Of Change is set for a 21 period. This indicator looks back 21 days and compares price action from the past to the present. With the Rate Of Change, prices are rising when signals are positive. Conversely, prices are falling when signals are negative. As an advance rises the Rate Of Change signal should also rise higher, otherwise the rally is suspect. A decline should see the Rate Of Change fall into negative signals. The more negative the signals the stronger the decline.
Support and Resistance Levels To Be Aware Of:
4400 is resistance
4370 is light support
4350 is light resistance
4300 is light resistance
4290 is light resistance
4270 is light resistance
4250 is resistance
4225 is light resistance
4200 is light resistance
4150 is light support
4100 is light support
4050 is light support
4025 is light support
4000 is good support
3975 is light support and is a decline of 17.5%
3900 is good support and is a decline of 19%
3850 is good support and is a decline of 20%
3600 is good support at is a decline of 25%
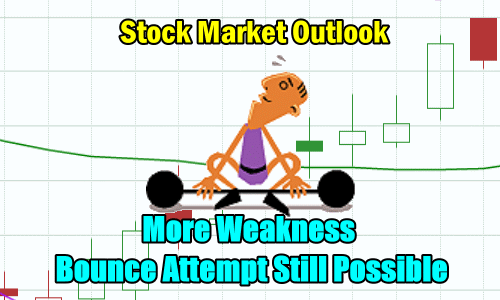
Stock Market Outlook for Tomorrow – Thu Jun 9 2022
For Thursday the technical indicators have turned more bearish. Most have lost strength. In particular the MACD indicator is continuing its decline. Each day since June 2 the technical indicator has lost its bullish signal. This is quite cautionary. The best bullish signal is the Rate Of Change which has finally turned positive after almost 7 weeks of being negative. However the remaining indicators are advising that investors should expect s sideways to lower close on Thursday as investors prepare for the latest inflation numbers which are released on Friday. A move higher in inflation numbers will see the SPX fall. Any decline in inflation should see the SPX move higher. But for Thursday expect more weakness but a bounce attempt is still possible. The outlook though has turned back to bearish.
Potential Market Moving Events
This week the primary events that could see markets shift are on Friday.
Wednesday:
10:00 Wholesale Inventories revision rose to 2.2% which is up one tenth of a percent. That’s not a major change but it is higher.
Thursday:
8:30 Initial jobless claims
8:30 Continuing jobless claims
Friday:
8:30 Monthly Consumer Price Index
8:30 Core CPI
8:30 CPI year-over-year
8:30 Core CPI year-over-year
10:00 5 Year Inflation expectations
Stock Market Outlook Archives
Stock Market Outlook For Wed May 6 2026 – Choppy But Higher Still

Morning Investing Strategy Notes for Tue May 5 2026

Stock Market Outlook For Tue May 5 2026 – Overbought and Lower

Morning Investing Strategy Notes for Mon May 4 2026
Stock Market Outlook For Mon May 4 2026 – Dips Likely With Possible Lower Close

Morning Investing Strategy Notes for Fri May 1 2026
Stock Market Outlook For Fri May 1 2026 – Overbought But Higher

Morning Investing Strategy Notes for Thu Apr 30 2026
Stock Market Outlook For Thu Apr 30 2026 – Dips Likely Possible Lower Close
Morning Investing Strategy Notes for Wed Apr 29 2026
Stock Market Outlook For Wed Apr 29 2026 – Choppy But Higher Ahead Of More Earnings

Morning Investing Strategy Notes for Tue Apr 28 2026