
Markets staged an impressive morning rally but by the end of the day the rally had failed. Stock indexes closed down at their lows for the day. For the second time in a week indexes sustained large losses. Wednesday’s loss was the second largest of the month. Combined with Monday’s loss, the S&P is down 55.25 for the week.
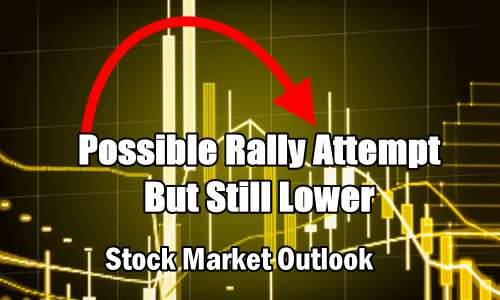
Stock Market Outlook Chart Comments At The Close on Wed Jun 27 2018
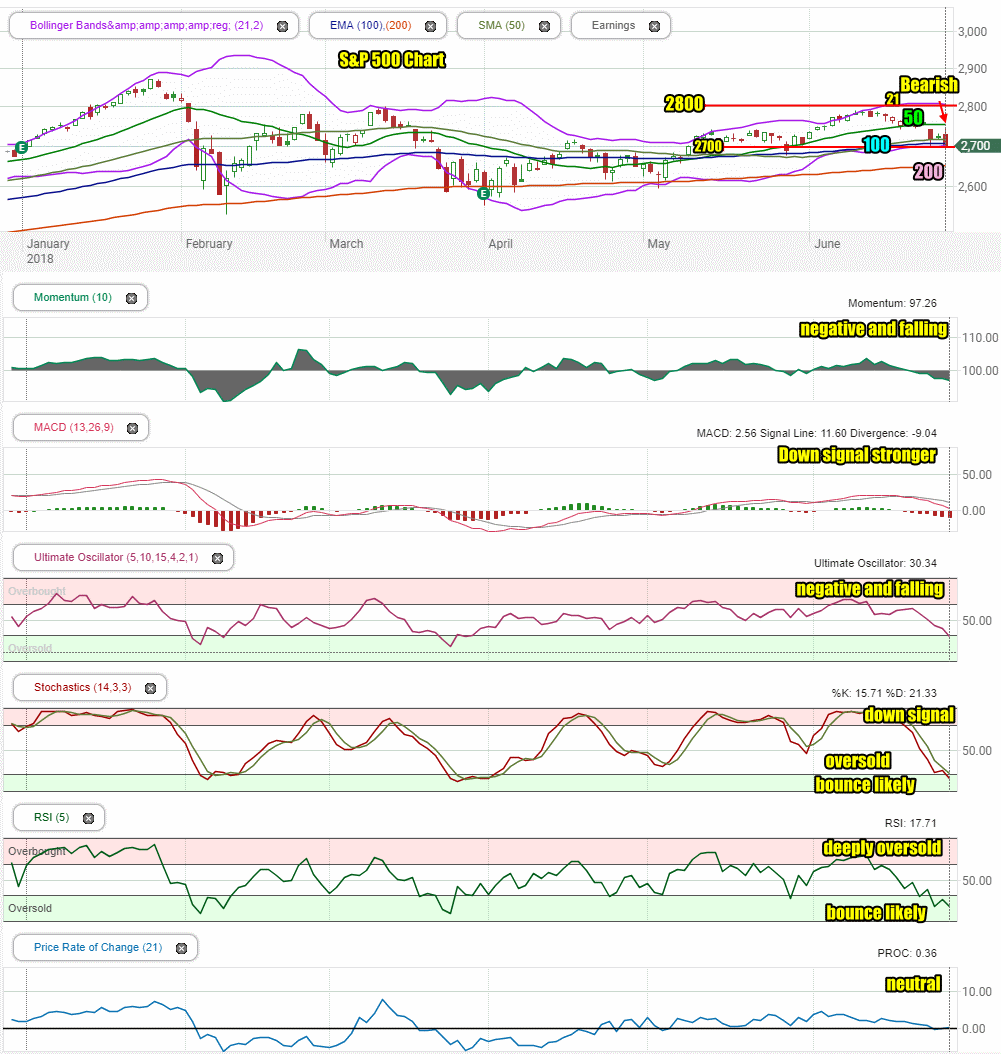
The S&P closed at the 100 day moving average on Wednesday which should see the S&P attempt a bounce but the losing candlestick on Wednesday was strongly bearish.
The moving averages are all still climbing although the 21 day is now starting to turn lower.
The chart remains bearish.
Stock Market Outlook review of Wed Jun 27 2018
Stock Market Outlook: Technical Indicators Review:
Momentum: For momentum I use a 10 period when studying market direction. Momentum is negative and still falling.
MACD Histogram: For MACD Histogram, I am using the Fast Points set at 13, Slow Points at 26 and Smoothing at 9.MACD (Moving Averages Convergence / Divergence) issued a a down signal on Jun 19. It was stronger yet again on Wednesday.
Ultimate Oscillator: The Ultimate Oscillator settings are: Period 1 is 5, Period 2 is 10, Period 3 is 15, Factor 1 is 4, Factor 2 is 2 and Factor 3 is 1. These are not the default settings but are the settings I use with the S&P 500 chart set for 1 to 3 months. The Ultimate Oscillator signal is negative and falling. It is touching into oversold signals.
Slow Stochastic: For the Slow Stochastic I use the K period of 14 and D period of 3. The Slow Stochastic tries to predict the market direction further out than just one day. The Slow Stochastic is signaling lower for the index and is oversold. Yesterday the signals looked like they might turn up. Tonight they are pointing lower. They are very oversold and normally we see a bounce shortly.
Relative Strength Index: The relative strength index is set for a period of 5 which gives it 5 days of market movement to monitor. It is often the first indicator to show an overbought or oversold signal. The RSI signal is deeply oversold and is into readings that are reaching bounce levels.
Rate of Change: Rate Of Change is set for a 21 period. This indicator looks back 21 days and compares price action from the past to the present. With the Rate Of Change, prices are rising when signals are positive. Conversely, prices are falling when signals are negative. As an advance rises the Rate Of Change signal should also rise higher, otherwise the rally is suspect. A decline should see the Rate Of Change fall into negative signals. The more negative the signals the stronger the decline. The rate of change signal is neutral on the market direction for Thursday so as such we could see another down day.
Support Levels To Be Aware Of:
2745 to 2750 was light support
2725 is light support.
2700 is support.
2675 is light support.
2650 is light support
2620 is light support
2600 is strong support.
There is good support at the 2550 level from where the market bounced back from the recent correction low on Feb 9.
The S&P has light support at 2480. It also has light support at 2450 and good support at 2425. Below that there is some support at 2400, 2380, 2350. 2300 has the most support at present but would represent a full correction as a drop to this level would be 20% and just 5% away from a potential bear market signal.
Stock Market Outlook for Tomorrow – Thu Jun 28 2018
For Thursday all three indexes gave up their morning rallies. The losses were quite large when you consider they were from the morning highs. Normally at this stage we see a rally attempt but after two failed rallies the S&P will probably move lower before it can stage a stronger rally. It is a question of finding buyers. If buyers believe the market is moving lower they will wait for better prices. That will send the index lower. It won’t take much to get the indexes back climbing but until investors feel more “secure” on the tariff war front, stocks are going to remain volatile and under pressure. Thursday is set for a possible third rally attempt and a move below 2700 for a negative day.
Stock Market Outlook Archives
Stock Market Outlook For Wed May 6 2026 – Choppy But Higher Still

Morning Investing Strategy Notes for Tue May 5 2026

Stock Market Outlook For Tue May 5 2026 – Overbought and Lower

Morning Investing Strategy Notes for Mon May 4 2026
Stock Market Outlook For Mon May 4 2026 – Dips Likely With Possible Lower Close

Morning Investing Strategy Notes for Fri May 1 2026
Stock Market Outlook For Fri May 1 2026 – Overbought But Higher

Morning Investing Strategy Notes for Thu Apr 30 2026
Stock Market Outlook For Thu Apr 30 2026 – Dips Likely Possible Lower Close
Morning Investing Strategy Notes for Wed Apr 29 2026
Stock Market Outlook For Wed Apr 29 2026 – Choppy But Higher Ahead Of More Earnings

Morning Investing Strategy Notes for Tue Apr 28 2026