
 Prior Trading Day Summary
On Wed Jul 30 2025 stocks slipped lower while waiting on earnings from Microsoft, META and others. The Fed didn’t help stocks any as they kept interest rates unchanged continuing to cite concerns about possible tariff induced inflation. I have been trading since the 1970’s and I have not seen a time when the Fed tries to setup policy based on their prediction of what they think could happen. Instead they base interest rate decisions on what is happening. However the present Fed seems intent on trying to guess what they think will happen and base their policies on future expectations. They seem to have moved from being “data dependent” by their own admission to “data prediction”. This could once again be a mistake as interest rate changes take months to work their way into the economy, both decreases and increases in interest rates. However I’m not an economist, just an investor.
The day ended with the SPX down slightly by 8 points to 6363 and the NASDAQ up slightly by 31 points to 21129.
Lets review the closing technical indicators from Wed Jul 30 2025 to see what they predict for Thu Jul 31 2025.
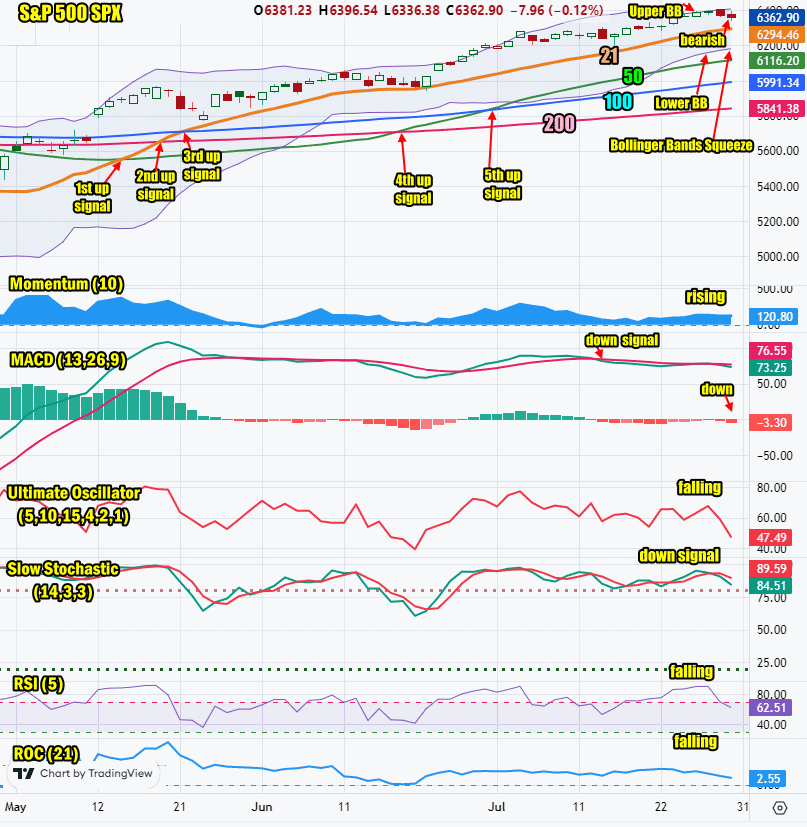
Stock Market Outlook: SPX Closing Chart For Wed Jul 30 2025
The index closed just below the Upper Bollinger Band which is a bit bearish.
The closing candlestick is bearish but with long shadows which usually indicate a bounce is likely intraday.
The 21 day moving average is rising and closed at 6294 which is bullish.
The 50 day moving average is rising and closed at 6116 which is bullish.
The 100 day moving average is rising and closed at 5991 which is bullish.
The 200 day moving average is rising and closed at 5841 which is bullish.
The Lower Bollinger Band is continuing to rise and above the 50 day moving average which is bullish. The Upper Bollinger Band is rising. The Bollinger Bands Squeeze commenced on Wednesday last week. At present the outlook is for stocks to move higher out of the Bollinger Bands Squeeze.
The SPX chart is more bullish than bearish heading into Thu Jul 31 2025.
SPX Stock Market Outlook review of Wed Jul 30 2025
Stock Market Outlook: Technical Indicators Review
Momentum: Momentum is rising and positive.
|
MACD Histogram: MACD (Moving Averages Convergence / Divergence) issued a down signal on Tue Jul 15. On Wed Jul 30 2025 the down signal gained some strength, removing the potential for a MACD up signal on Wednesday.
|
Ultimate Oscillator: The Ultimate Oscillator is falling.
|
Slow Stochastic: The Slow Stochastic has a down signal in place.
|
Relative Strength Index: The RSI signal is falling.
|
| Rate of Change: The rate of change signal is falling, signaling a lower close for Thursday. Settings: Rate Of Change is set for a 21 period. This indicator looks back 21 days and compares price action from the past to the present. With the Rate Of Change, prices are rising when signals are positive. Conversely, prices are falling when signals are negative. As an advance rises, the Rate Of Change signal should also rise higher, otherwise the rally is suspect. A decline should see the Rate Of Change fall into negative signals. The more negative the signals the stronger the decline. |
Stock Market Outlook: Support and Resistance Levels |
| 6400 is resistance |
| 6390 is resistance |
| 6365 is resistance |
| 6350 is resistance |
| 6325 is resistance |
| 6300 is resistance |
| 6250 is resistance |
| 6225 is resistance |
| 6200 is resistance |
| 6175 is resistance |
| 6150 is resistance |
| 6125 is resistance |
| 6100 is support |
| 6075 is support |
| 6050 is support |
| 6025 is support |
| 6000 is support |
| 5990 is support |
| 5975 is support |
| 5950 is support |
| 5925 is support |
| 5900 is support |
Stock Market Outlook for Thu Jul 31 2025
On Wednesday the economic reports showed the economy is continuing to do well with GDP coming in at 3.0%, well above estimates of 2.3%
For Thursday, strong earnings from Microsoft and Meta as well as a handful of other companies, should be enough to propel the index higher.
With the technical indicators all pointing lower, I am expecting a switch to a higher close on Thursday.
Potential Economic and Political Market Moving Events
Monday:
There are no events
Tuesday:
8:30 Advanced trade balance in goods surprised strongly with $86.0 billion easily beating estimated of -$96.4 billion.
8:30 Advanced retail inventories icame in as estimated at 0.3%
8:30 Advanced wholesale inventories was stronger than estimated, at 0.2%
9:00 Case Shiller home price index was lower than estimated at 2.8%
10:00 Consume confidence was higher than estimated at 97.2
10:00 Job openings were lower than estimated at 7.4 million
Wednesday:
8:15 ADP Employment is expected to rise to 64,000 but rose to 104,000 instead
8:30 GDP rose to 3.0% well beyond estimates of 2.3%
10:00 Pending home sales were expected to rise 0.2% but instead fell -0.8%
2:00 Fed Chair Powell announces latest interest rate decision and attends news conference
Thursday:
8:30 Weekly Initial Unemployment Insurance Claims are expected to rise to 222,000
8:30 Personal income s estimated to fall to 0.8% from 0.9%
8:30 Personal spending is expected to rise to 0.4% from -0.1% prior
8:30 PCE Index is estimate to rise to 0.3% from 0.1% prior
8:30 Personal Consumption Expenditures year-over-year is estimated to rise to 2.5% from 2.3% prior
8:30 Core PCE index is estimated unchanged at 0.2%
9:30 Core PCE year-over-year is estimated to remain unchanged at 2.7%