

Prior Trading Day Summary
On Wednesday stocks moved higher into more record breaking territory as investors were enthused by news of the tariff deal with Japan.
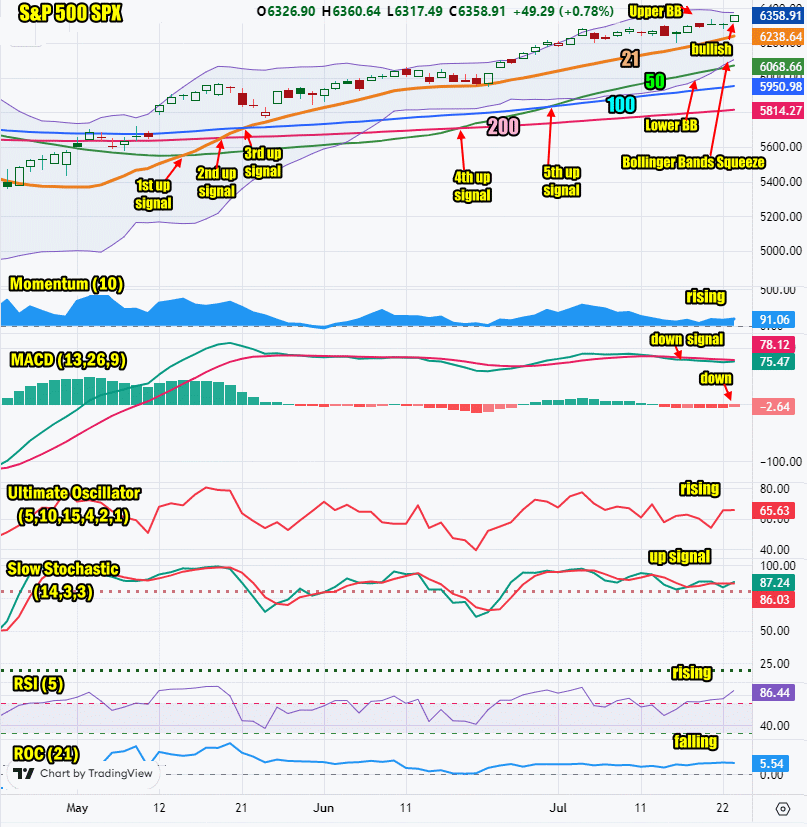
By the close the S&P was up 49 points to 6359 on 5.7 billion shares traded/
The NASDAQ closed up 127 points on 11.5 billion shares traded. It ended the day at 21020, another new closing high.
For Thu Jul 24 2025 investors should review the Stock Market Technical Outlook before trading resumes.
Stock Market Outlook: SPX Closing Chart For Wed Jul 23 2025
The index at the Upper Bollinger Band marking another new closing high. 75% of the volume traded was to the upside.
The closing candlestick is bullish for Thursday.
The 21 day moving average is rising and closed at 6238 which is bullish.
The 50 day moving average is rising and closed at 6068 which is bullish.
The 100 day moving average is rising and closed at 5950which is bullish.
The 200 day moving average is rising and closed at 5814 which is bullish.
The Lower Bollinger Band is rising and above the 50 day moving average which is bullish. The Upper Bollinger Band is falling as a Bollinger Bands Squeeze commenced on Wednesday. At present the outlook is for stocks to move higher, at least at the start of the latest Bollinger Bands Squeeze.
The SPX chart is more bullish than bearish heading into Thursday.
SPX Stock Market Outlook review of Wed Jul 23 2025
Stock Market Outlook: Technical Indicators Review
Momentum: Momentum is rising and positive.
|
MACD Histogram: MACD (Moving Averages Convergence / Divergence) issued a down signal on Tue Jul 15. On Wed Jul 23 2025 the down signal lost strength.
|
Ultimate Oscillator: The Ultimate Oscillator is rising.
|
Slow Stochastic: The Slow Stochastic has a weak down signal in place.
|
Relative Strength Index: The RSI signal is rising.
|
| Rate of Change: The rate of change signal is falling, signaling a lower close for Thursday. Settings: Rate Of Change is set for a 21 period. This indicator looks back 21 days and compares price action from the past to the present. With the Rate Of Change, prices are rising when signals are positive. Conversely, prices are falling when signals are negative. As an advance rises, the Rate Of Change signal should also rise higher, otherwise the rally is suspect. A decline should see the Rate Of Change fall into negative signals. The more negative the signals the stronger the decline. |
Stock Market Outlook: Support and Resistance Levels |
| 6350 is resistance |
| 6325 is resistance |
| 6300 is resistance |
| 6250 is resistance |
| 6225 is resistance |
| 6200 is resistance |
| 6175 is resistance |
| 6150 is resistance |
| 6125 is resistance |
| 6100 is resistance |
| 6075 is resistance |
| 6050 is support |
| 6025 is support |
| 6000 is support |
| 5990 is support |
| 5975 is support |
| 5950 is support |
| 5925 is support |
| 5900 is support |
| 5850 is support |
| 5800 is support |
Stock Market Outlook for Thu Jul 24 2025
Earnings from a number of stocks on Wednesday after the close were poorer than anticipated and that might weigh on stocks in the morning, especially at the open. However any dips are opportunities to setup trades as the outlook is still higher for Thursday.
Potential Economic and Political Market Moving Events
Monday:
10:00 Leading economic indicators were lower than estimated at -0.3%
Tuesday:
There are no economic reports today
Wednesday:
10:00 Existing home sales fell to 3.93 million, down from 4.04 million prior.
Thursday:
8:30 Weekly Initial Unemployment Insurance Claims are estimated to come in at 227,000 up from 221,000 prior
9:45 S&P flash services PMI is estimated to rise to 53.2 from 52.9
9:45 S&P flash manufacturing PMI is estimated to dip to 52.7 from 52.9 prior.
10:00 New homes sales are expected to come in at 645,000 up from 623,000 prior