

Wed Jan 30 2019 was all about the Fed decision on interest rates. Investors were already buying and sending the S&P and Dow indexes higher before the Fed announcement at 2:00 PM. When the announcement was released indicating no interest rate hike and a more cautious approach by the Fed, stocks moved higher. By the end of the day the S&P and NASDAQ both has their second best day of January.
Stock Market Outlook Chart Comments At The Close on Wed Jan 30 2019
The S&P chart is still bearish with 6 sell signals. That said, there are more bullish signs today by the close. The S&P ended the day above the 100 day moving average. That places it above the 100, 50 and 21 day moving averages. The index closed at the highest level since the start of December.
The Lower Bollinger Band and now the Upper Bollinger Band are turning higher indicating there is more upside ahead for the S&P.
The 21 day moving average is almost ready to push above the 50 day. When that happens it will be the first buy signal.
The closing candlestick on Wednesday is bullish.
While the overall chart is still bearish due to the 6 sell signals, there are significant signals advising that this rally may not revisit the lows of December 24 which so many investors believe will happen.
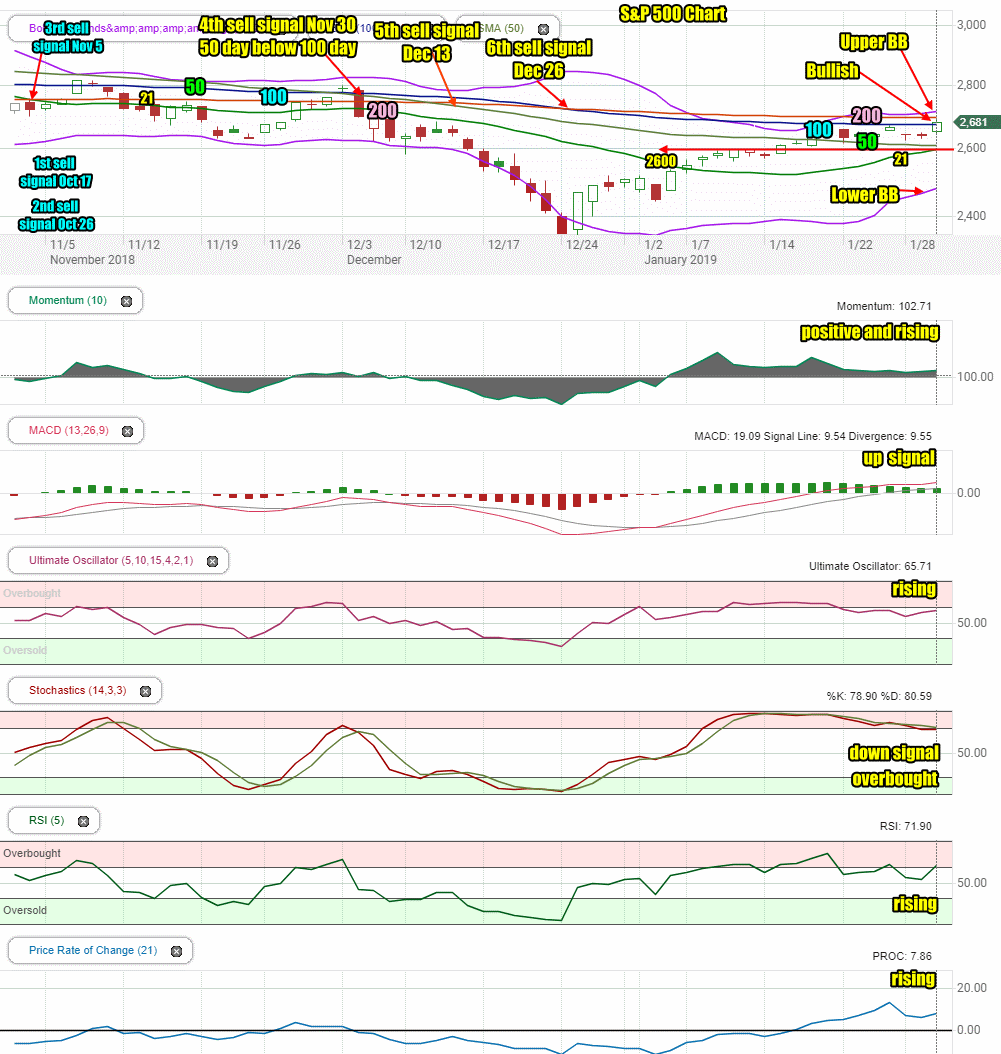
Stock Market Outlook review of Wed Jan 30 2019
Stock Market Outlook: Technical Indicators Review:
Momentum: Momentum is positive and was rising on Wednesday.
- Settings: For momentum I use a 10 period when studying market direction.
MACD Histogram: MACD (Moving Averages Convergence / Divergence) issued an up signal on Fri Jan 4 2019. That up signal was stronger today.
- Settings: For MACD Histogram, I am using the Fast Points set at 13, Slow Points at 26 and Smoothing at 9.
Ultimate Oscillator: The Ultimate Oscillator signal is rising.
- Settings: The Ultimate Oscillator settings are: Period 1 is 5, Period 2 is 10, Period 3 is 15, Factor 1 is 4, Factor 2 is 2 and Factor 3 is 1. These are not the default settings but are the settings I use with the S&P 500 chart set for 1 to 3 months.
Slow Stochastic: The Slow Stochastic has a weak down signal in place for Thursday is still overbought.
- Settings: For the Slow Stochastic I use the K period of 14 and D period of 3. The Slow Stochastic tries to predict the market direction further out than just one day.
Relative Strength Index: The RSI signal is rising..
- Settings: The relative strength index is set for a period of 5 which gives it 5 days of market movement to monitor. It is often the first indicator to show an overbought or oversold signal.
Rate of Change: The rate of change signal is also rising..
- Settings: Rate Of Change is set for a 21 period. This indicator looks back 21 days and compares price action from the past to the present. With the Rate Of Change, prices are rising when signals are positive. Conversely, prices are falling when signals are negative. As an advance rises the Rate Of Change signal should also rise higher, otherwise the rally is suspect. A decline should see the Rate Of Change fall into negative signals. The more negative the signals the stronger the decline.
Support Resistance Levels To Be Aware Of:
2900 was support – this will be strong resistance
2860 was support – this will be resistance
2830 was light support and will be light resistance
2800 is strong resistance
2795 is light resistance
2745 to 2750 is light resistance
2725 is light resistance
2700 is resistance
2675 is light resistance
2650 is support
2625 is light support
2600 is support.
There was good support at the 2550 level which is back to being support.
The 2500 level is support.
The S&P has light support at 2480 and better support at 2450.
There is good support at 2425.
Below that there is some support at 2400, 2380, 2350.
2300 has the most support at present but would represent a full correction of 641 points as a drop to this level would be 21% and just 5% away from a full bear market signal ending the bull market from 2009.
Stock Market Outlook for Tomorrow – Thu Jan 31 2019
The technical indicators have only one signal that is bearish, the Slow Stochastic. All the other signals are pointing up for the index.
While there are bound to be dips back, and indeed the 2675 and 2700 levels are resistance, the index will be higher at the close on Thursday.
Dips are once again opportunities to set up more trades and I will be bringing more capital into trades on Thursday and Friday as the outlook is still higher with the S&P ready to push above 2700. This Fed-induced rally should last for at least the remainder of the week.
Stock Market Outlook Archives
Stock Market Outlook For Wed May 6 2026 – Choppy But Higher Still

Morning Investing Strategy Notes for Tue May 5 2026

Stock Market Outlook For Tue May 5 2026 – Overbought and Lower

Morning Investing Strategy Notes for Mon May 4 2026
Stock Market Outlook For Mon May 4 2026 – Dips Likely With Possible Lower Close

Morning Investing Strategy Notes for Fri May 1 2026
Stock Market Outlook For Fri May 1 2026 – Overbought But Higher

Morning Investing Strategy Notes for Thu Apr 30 2026
Stock Market Outlook For Thu Apr 30 2026 – Dips Likely Possible Lower Close
Morning Investing Strategy Notes for Wed Apr 29 2026
Stock Market Outlook For Wed Apr 29 2026 – Choppy But Higher Ahead Of More Earnings

Morning Investing Strategy Notes for Tue Apr 28 2026