
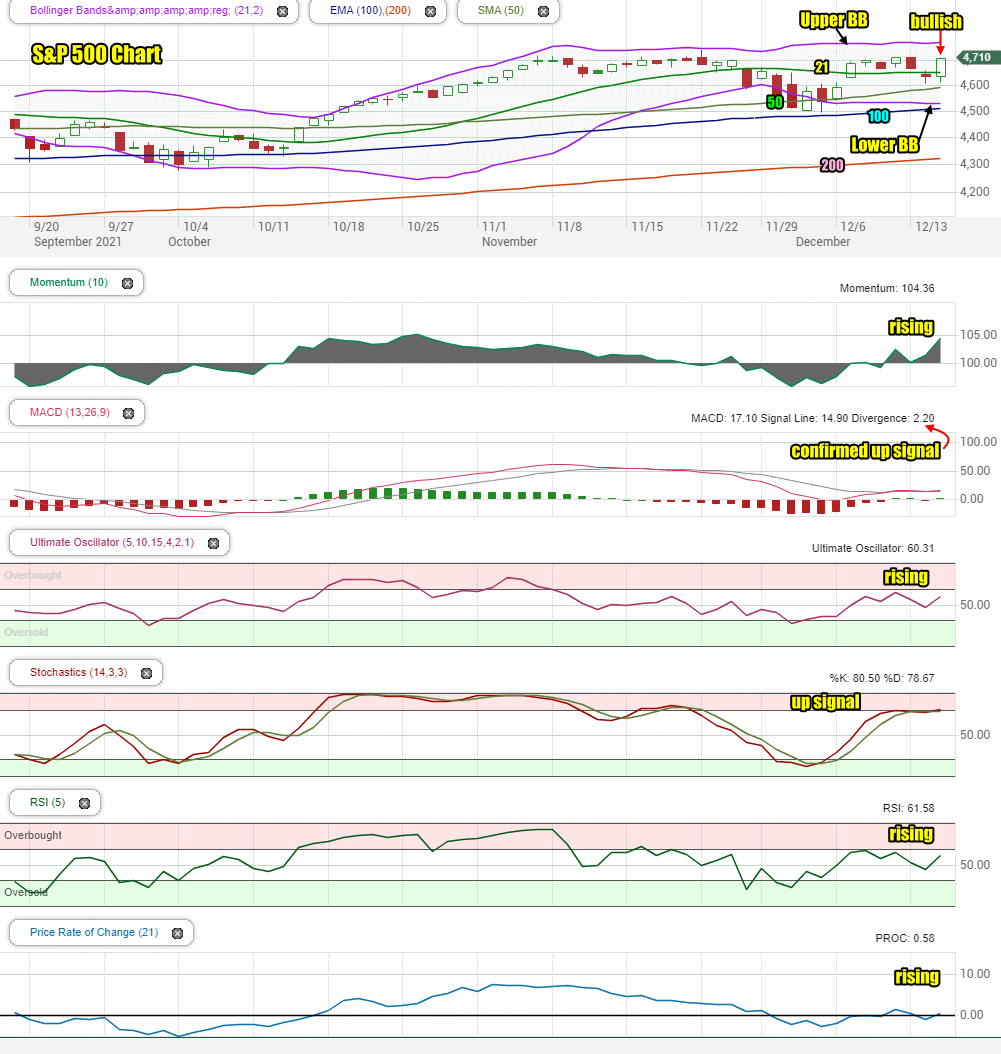
Investors and analysts fears were unfounded on Wednesday when Fed Chair Powell’s decision on holding interest rates at historic lows well into 2022 while tapering, not stopping, bond purchases caught them by surprise. The markets shot higher after the announcement and conference from an earlier sell-off. In the end the S&P rose 75 points for a strong 1.63% gain. The S&P closed just shy of the day’s high at 4709 and and just 37 points from the all-time intraday high of 4743. The strong gain also saw a confirmed up signal from the MACD indicator.
The NASDAQ which slipped below the 100 day moving average earlier in the day staged stunning reversal and closed up 328 points for a 2.15% rally. From the low of the day of 15055, the NASDAQ gain 520 points and retook the 100 and 50 day moving averages and closed just below the 21 day moving average, The index ended the day at 15565, just 10 points from the intraday high.
It was a stunning reversal for stocks and has set up the markets for further gains that could last into the end of the year.
Let’s review the technical indicators at the close on Wed Dec 15 2021 to see what to expect for Thursday.
Stock Market Outlook Chart Comments At The Close on Wed Dec 15 2021
The closing candlestick on Wednesday is bullish and signaling overbought. Normally with this candlestick, we can expect some selling in the morning but a higher close.
The index closed above all major moving averages including the 21 day, which is bullish.
All the major moving averages are back climbing and the Lower Bollinger Band is falling toward the 100 day which is bullish.
For Thursday there are no bearish signals of concern in the S&P chart.
Stock Market Outlook review of Wed Dec 15 2021
Stock Market Outlook: Technical Indicators Review:
Momentum: Momentum is rising and positive.
- Settings: For momentum I use a 10 period when studying market direction.
MACD Histogram: MACD (Moving Averages Convergence / Divergence) issued a confirmed up signal on Wed Dec 15 2021 . The signal looks strong enough to last into the end of the month.
- Settings: For MACD Histogram, I am using the Fast Points set at 13, Slow Points at 26 and Smoothing at 9.
Ultimate Oscillator: The Ultimate Oscillator is rising.
- Settings: The Ultimate Oscillator settings are: Period 1 is 5, Period 2 is 10, Period 3 is 15, Factor 1 is 4, Factor 2 is 2 and Factor 3 is 1. These are not the default settings but are the settings I use with the S&P 500 chart set for 1 to 3 months.
Slow Stochastic: The Slow Stochastic has an up signal for tomorrow.
Settings: For the Slow Stochastic I use the K period of 14 and D period of 3. The Slow Stochastic tries to predict the market direction further out than just one day.
Relative Strength Index: The RSI signal is rising.
- Settings: The relative strength index is set for a period of 5 which gives it 5 days of market movement to monitor. It is often the first indicator to show an overbought or oversold signal.
Rate of Change: The rate of change signal is rising.
- Settings: Rate Of Change is set for a 21 period. This indicator looks back 21 days and compares price action from the past to the present. With the Rate Of Change, prices are rising when signals are positive. Conversely, prices are falling when signals are negative. As an advance rises the Rate Of Change signal should also rise higher, otherwise the rally is suspect. A decline should see the Rate Of Change fall into negative signals. The more negative the signals the stronger the decline.
Support and Resistance Levels To Be Aware Of:
4725 is resistance
4700 is resistance
4655 is light support.
4600 is good support
4550 is light support
4525 is light support
4500 is support
Stock Market Outlook for Tomorrow – Thu Dec 16 2021
For Thursday all the technical indicators are pointing higher. The index is a bit overbought after the massive rally on Wednesday. That means investors should expect a morning dip or some weakness but the close will be higher.
Stock Market Outlook Archives
Stock Market Outlook For Wed May 6 2026 – Choppy But Higher Still

Morning Investing Strategy Notes for Tue May 5 2026

Stock Market Outlook For Tue May 5 2026 – Overbought and Lower

Morning Investing Strategy Notes for Mon May 4 2026
Stock Market Outlook For Mon May 4 2026 – Dips Likely With Possible Lower Close

Morning Investing Strategy Notes for Fri May 1 2026
Stock Market Outlook For Fri May 1 2026 – Overbought But Higher

Morning Investing Strategy Notes for Thu Apr 30 2026
Stock Market Outlook For Thu Apr 30 2026 – Dips Likely Possible Lower Close
Morning Investing Strategy Notes for Wed Apr 29 2026
Stock Market Outlook For Wed Apr 29 2026 – Choppy But Higher Ahead Of More Earnings

Morning Investing Strategy Notes for Tue Apr 28 2026