

Wed Aug 1 2018 saw the S&P reach a morning high of 2825 and an afternoon low of 2805 before the index managed to close down just 3 points at 2813.36. In the afternoon the Fed decision to not raise interest rates further helped the market push back from the day’s low of 2805. As well Apple Stock assisted many other stocks in staying positive on the day which also helped the index recapture most of the earlier intraday drop in the index. Here’s the outlook for Thu Aug 2 2018.
Stock Market Outlook Chart Comments At The Close on Wed Aug 1 2018
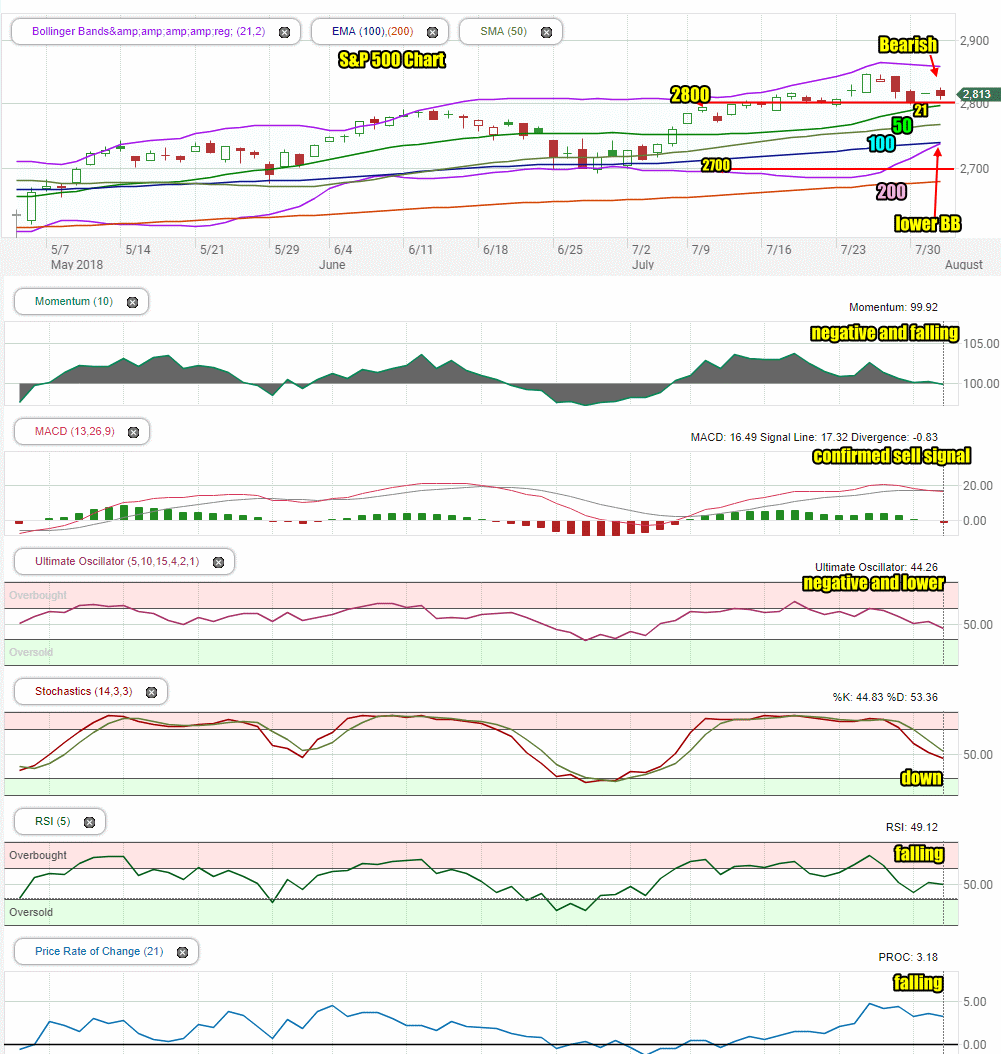
The S&P ended the day on Wednesday still above 2800. The closing candlestick is however bearish for Thursday.
All the major moving averages are still rising but the Lower Bollinger Band has moved up to the 100 day moving average and is preparing to cross above it. The Upper Bollinger Band is turning lower. The likelihood of a Bollinger Bands Squeeze forming up by Friday or early next week is high and at present the Bollinger Bands Squeeze looks set to signal a move lower in the index.
The SPX chart is still bullish primarily as the index has not yet reached the 21 day moving average. A move below the 21 day moving average will turn the chart bearish.
Stock Market Outlook review of Wed Aug 1 2018
Stock Market Outlook: Technical Indicators Review:
Momentum: For momentum I use a 10 period when studying market direction. Momentum is negative and moving lower.
MACD Histogram: For MACD Histogram, I am using the Fast Points set at 13, Slow Points at 26 and Smoothing at 9. MACD (Moving Averages Convergence / Divergence) issued a down signal on Jul 31. Today, Wed Aug 1 2018 the down signal was confirmed.
Ultimate Oscillator: The Ultimate Oscillator settings are: Period 1 is 5, Period 2 is 10, Period 3 is 15, Factor 1 is 4, Factor 2 is 2 and Factor 3 is 1. These are not the default settings but are the settings I use with the S&P 500 chart set for 1 to 3 months. The Ultimate Oscillator signal is negative and falling.
Slow Stochastic: For the Slow Stochastic I use the K period of 14 and D period of 3. The Slow Stochastic tries to predict the market direction further out than just one day. The Slow Stochastic is no longer overbought and has a strong down signal for Thursday.
Relative Strength Index: The relative strength index is set for a period of 5 which gives it 5 days of market movement to monitor. It is often the first indicator to show an overbought or oversold signal. The RSI signal is rfalling.
Rate of Change: Rate Of Change is set for a 21 period. This indicator looks back 21 days and compares price action from the past to the present. With the Rate Of Change, prices are rising when signals are positive. Conversely, prices are falling when signals are negative. As an advance rises the Rate Of Change signal should also rise higher, otherwise the rally is suspect. A decline should see the Rate Of Change fall into negative signals. The more negative the signals the stronger the decline. The rate of change signal is falling.
Support Levels To Be Aware Of:
2795 is light support
2745 to 2750 is light support
2725 is light support.
2700 is support.
2675 is light support.
2650 is light support
2620 is light support
2600 is strong support.
There is good support at the 2550 level from where the market bounced back from the recent correction low on Feb 9.
The S&P has light support at 2480. It also has light support at 2450 and good support at 2425. Below that there is some support at 2400, 2380, 2350. 2300 has the most support at present but would represent a full correction as a drop to this level would be 20% and just 5% away from a potential bear market signal.
Stock Market Outlook for Tomorrow – Thu Aug 2 2018
The signals have changed on the chart for the S&P for Thursday. MACD has a confirmed down signal in place. The Slow Stochastic is also pointing down. Two other technical indicators are now negative and 2 are pointing lower. There are no signals that show strength to the upside.
The signals have left behind a negative outlook for stocks for Thursday Aug 2 2018.
Stock Market Outlook Archives
Stock Market Outlook For Wed May 6 2026 – Choppy But Higher Still

Morning Investing Strategy Notes for Tue May 5 2026

Stock Market Outlook For Tue May 5 2026 – Overbought and Lower

Morning Investing Strategy Notes for Mon May 4 2026
Stock Market Outlook For Mon May 4 2026 – Dips Likely With Possible Lower Close

Morning Investing Strategy Notes for Fri May 1 2026
Stock Market Outlook For Fri May 1 2026 – Overbought But Higher

Morning Investing Strategy Notes for Thu Apr 30 2026
Stock Market Outlook For Thu Apr 30 2026 – Dips Likely Possible Lower Close
Morning Investing Strategy Notes for Wed Apr 29 2026
Stock Market Outlook For Wed Apr 29 2026 – Choppy But Higher Ahead Of More Earnings

Morning Investing Strategy Notes for Tue Apr 28 2026