

Day’s Summary
On Wednesday investors continued Tuesday’s sell-off and pushed indexes lower.
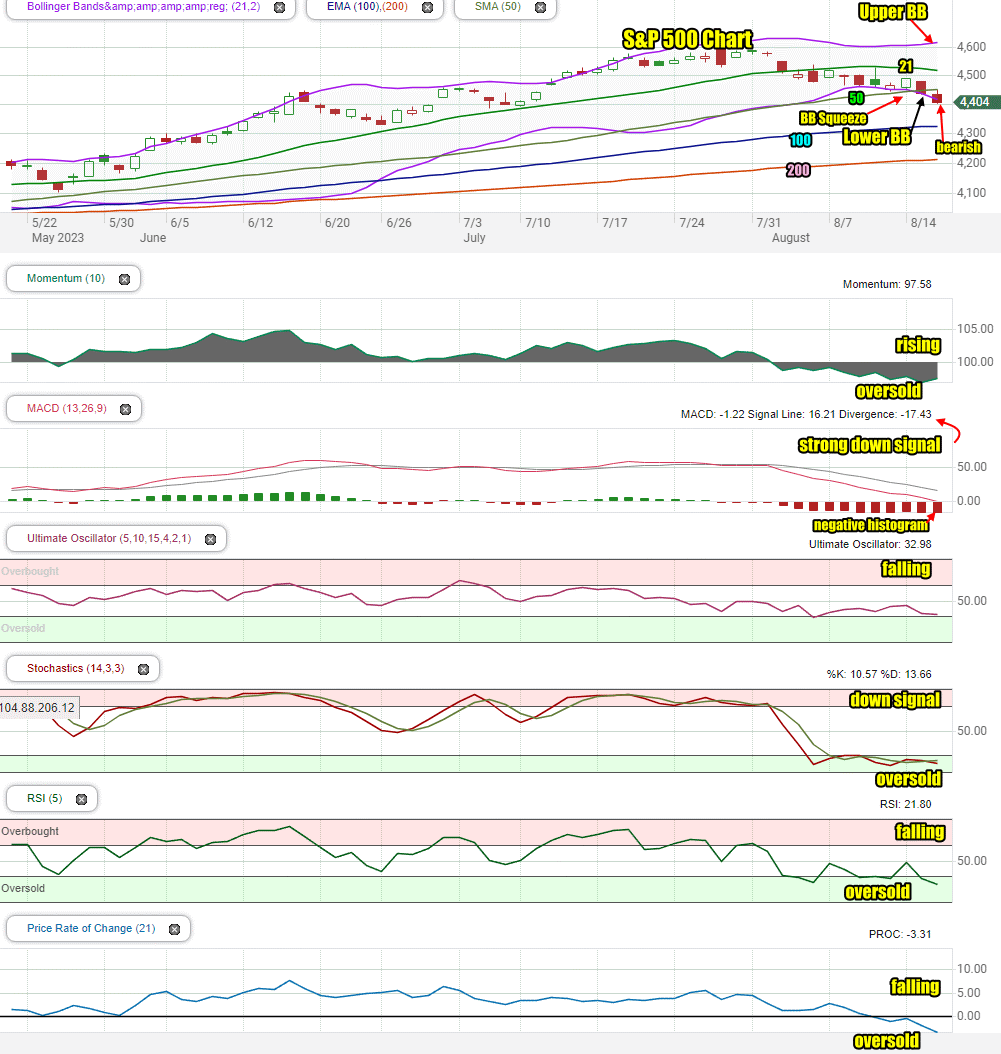
The S&P continued to fall below the 50 day moving average and ended down 33 points to 4403.33.
The NASDAQ saw the heaviest volume in weeks and new lows reached 290. The loss was 156 points to close at 13,474.
Let’s review the SPX index from Wednesday to see what to expect for Thursday.
Stock Market Outlook: SPX Closing Chart For Wed Aug 16 2023
The index closed below the 50 day moving average for the second time this week. This is bearish and the closing candlestick is also bearish for Thursday.
The closing candlestick on Wednesday is bearish but also signaling stocks are still extremely oversold.
The 21 day moving average is turned down which is bearish. The 50, 100 and 200 day moving averages are continuing to climb which is bullish.
The Lower Bollinger Band fell further and is bearish. The Upper Bollinger Band is turning higher which is often a signal of an impending bounce. A new Bollinger Bands Squeeze is still ongoing. At present the squeeze looks like stocks will move lower but often stocks actually dip and then recover to move higher.
Stock Market Outlook review of Wed Aug 16 2023
Stock Market Outlook: Technical Indicators Review
Momentum: Momentum is rising and negative. It is signaling oversold.
|
MACD Histogram: MACD (Moving Averages Convergence / Divergence) issued a down signal on Thursday Jul 27. On Wed Aug 16 2023 the down signal was stronger again. It is at a level where often we will see a strong bounce.
|
Ultimate Oscillator: The Ultimate Oscillator is falling, negative and trying to bounce from oversold.
|
Slow Stochastic: The Slow Stochastic has a down signal in place. It is very oversold and signaling there is a bounce coming.
|
Relative Strength Index: The RSI signal is falling sharply and entering oversold readings.
|
Rate of Change: The rate of change signal is falling and deeply oversold. Expect a bounce.
|
Stock Market Outlook: Support and Resistance Levels |
| 4600 is resistance |
| 4575 is resistance |
| 4550 is resistance |
| 4525 is resistance |
| 4500 is support |
| 4485 is support |
| 4470 is support |
| 4450 is support |
| 4435 is support |
| 4420 is support |
| 4400 is support |
| 4390 is support |
| 4370 is support |
| 4350 is support |
| 4340 is support |
| 4325 is support |
| 4310 is support |
| 4300 is support |
| 4290 is support |
| 4275 is support |
| 4250 is support |
| 4240 is support |
| 4225 is support |
| 4210 is support |
| 4200 is good support |
Stock Market Outlook for Thu Aug 17 2023
For Thursday the technical signals are advising that a bounce could happen at any time. The technical indicators are still signaling stocks are oversold and should bounce.
With stocks set to bounce on Thursday, we should see a higher day for the towels.
There is a good chance stocks may bounce back and close up on Thursday.
Potential Economic and Political Market Moving Events
Thursday:
8:30 Weekly Initial Unemployment Insurance Claims are expected to come in slightly lower at 240,000.
8:30 Philadelphia Fed is releasing the latest manufacturing survey,