

Prior Trading Day Summary:
On Wednesday the CPI numbers were not as weak as many analysts and investors had hoped but most felt the CPI numbers showed the Fed can begin to cut interest rates in September, as expected. The majority of analysts felt the CPI numbers showed the Fed’s higher interest rates are having the desired effect on the economy and inflation is slowing.
Stocks had some large swings intraday and by the close the indexes were up only slightly.
The SPX rose 21 points to close at 5455.
The NASDAQ closed up 5 points to 17,192.
Let’s review the closing technical indicators from Wed Aug 14 2024 to see what the signals advise for Thu Aug 15 2024.
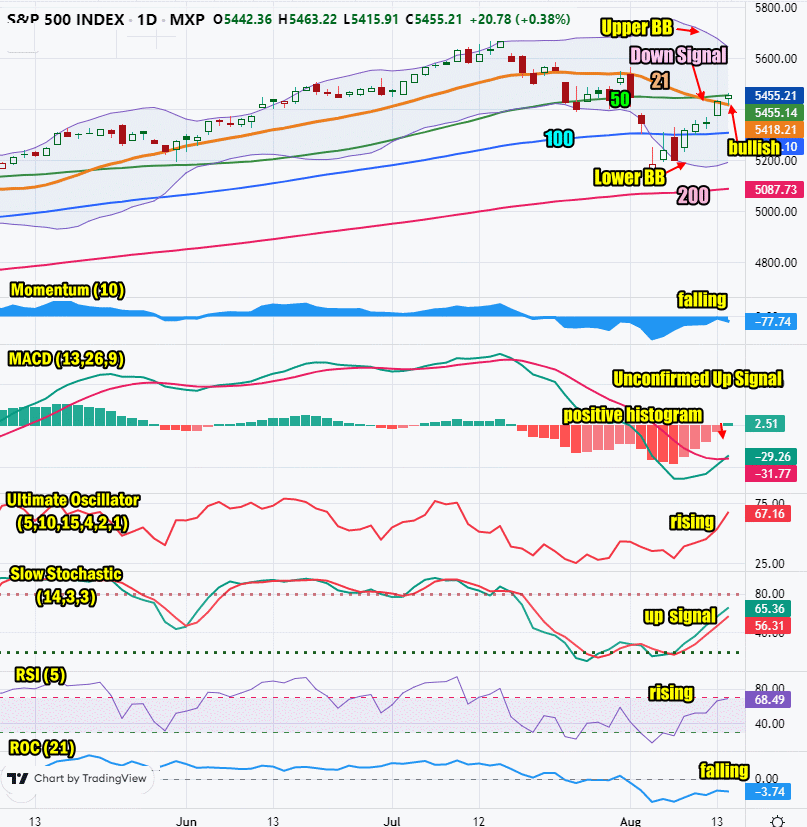
Stock Market Outlook: SPX Closing Chart For Wed Aug 14 2024
The index held above 5300 for a fifth day which is bullish.
The closing candlestick is bullish but the long shadow indicates the rally is slowing and we could see some weakness, especially in the morning.
The 21 day moving average is falling lower as the sell signal continues for the SPX. This is bearish.
The 50 day moving average is falling. This is also bearish.
The 100 day moving average is rising and closed at 5308 which is bullish.
The 200 day moving average is slowing its uptrend but still closed higher at 5087 which is bullish.
The Lower Bollinger Band is below the 100 day moving average but rising which is bullish.
The Upper Bollinger Band is still falling which is bearish.
The S&P chart is more bearish than bullish but there are a growing number of bullish signals for Thursday for the SPX.
SPX Stock Market Outlook review of Wed Aug 14 2024
Stock Market Outlook: Technical Indicators Review
Momentum: Momentum is falling, still negative but not oversold.
|
MACD Histogram: MACD (Moving Averages Convergence / Divergence) issued a down signal on Thur July 18. On Wed Aug 14 2024 the down signal was lost and replaced with an unconfirmed up signal.
|
Ultimate Oscillator: The Ultimate Oscillator is rising and positive.
|
Slow Stochastic: The Slow Stochastic has an up signal in place and rising.
|
Relative Strength Index: The RSI signal is rising and positive.
|
Rate of Change: The rate of change signal is falling signaling Thursday will end lower.
|
Stock Market Outlook: Support and Resistance Levels |
| 5500 is resistance |
| 5470 is resistance |
| 5450 is resistance |
| 5425 is resistance |
| 5400 is resistance |
| 5375 is resistance |
| 5350 is resistance |
| 5325 is resistance |
| 5310 is resistance |
| 5300 is resistance |
| 5275 is support |
| 5250 is support |
| 5225 is support |
| 5200 is support |
| 5175 is support |
| 5150 is support |
| 5125 is support |
Stock Market Outlook for Thu Aug 15 2024
For Thursday the SPX is dealing with an unconfirmed up signal from the MACD technical indicator. This is among the more accurate of signals. The Upper Bollinger Band and Lower Bollinger Band are possibly preparing to enter a Bollinger Bands Squeeze late this week or into next week which should send stocks higher. I am expecting the unconfirmed up signal to be confirmed by the MACD either Thursday or Friday.
On Thursday investors get earnings from Walmart which will give a good indication of how the consumer is doing. Unless earnings miss by a wide margin, stocks should continue higher which will confirm the MACD Up Signal.
Potential Economic and Political Market Moving Events
Monday:
2:00 Monthly federal budget rose as estimated to -241 billion.
Tuesday:
8:30 Producer price index (PPI) was lower to 0.1%
8:30 Core PPI rose to 0.3%
8:30 PPI year-over-year came in lower at 2.2%
8:30 Core PPI year-over-year was higher at 3.3%
Wednesday:
8:30 Consumer price index came in as estimated at 0.2%
8:30 CPI year-over-year came in lower at 2.9%
8:30 Core CPI rose as expected 0.2%
8:30 Core CPI year-over-year dipped as estimated to 3.2%
Thursday:
8:30 Weekly Initial Unemployment Insurance Claims are expected to come in at 235,000
8:30 Retail sales are expected to rise slightly to 0.3%
8:30 Retail sales minus autos is expected to fall to 0.1%
8:30 Import price index is expected to remain at 0.0%
9:15 Industrial production for July is estimated at -0.1%
9:15 Capacity utilization is estimated at 78.5%
10:00 Business inventories are estimated at 0.3%