
The outlook for Wednesday was for stocks to end the day lower. Weakness was anticipated. The market did try a rally early in the morning. It reached 2141.33 but spent the rest of the day falling. It broke through 2125 and moved to a low of 2119.90 before ending the day with a small rally and small loss.
Apple Stock impacted investors on Wednesday as it rose 3.54% to close at $111.77 on news of better than expected presales of the new iPhone 7. Meanwhile the US dollar weakened slightly, oil fell, bond yields rose to their highest level in 2 months and economic data out of China showed renewed growth which helped to spur commodity prices higher.
S&P Index Close
The S&P index closed down 1.25 points to 2,125.77.
Dow Jones Index Close
The Dow Jones fell 31.98 points to 18,034.77.
NASDAQ Index Close
The NASDAQ once again, had the best day of the three indexes rising 18.52 points to 5,173.77.
Stock Market Outlook – Technical Indicators At The Close
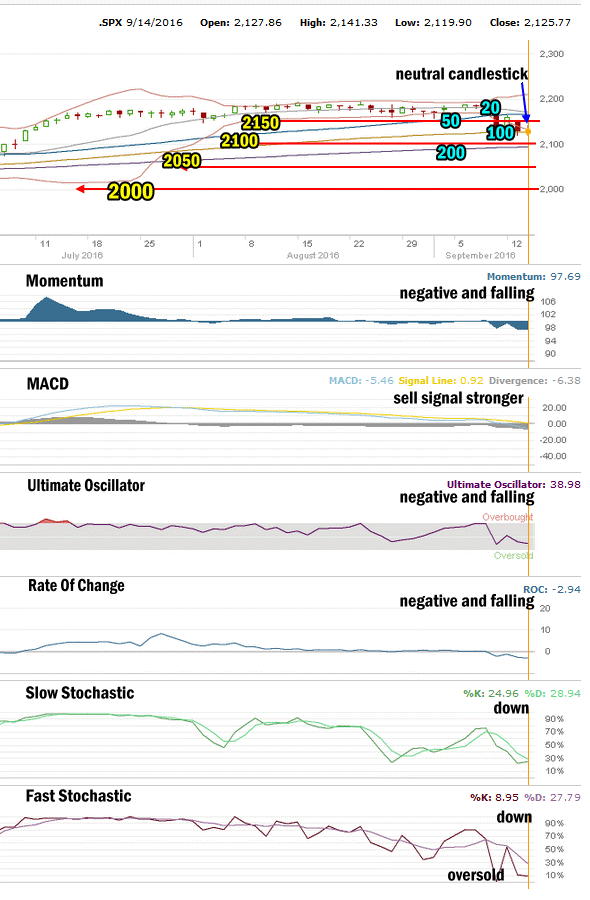
Stock Market Outlook – Sep 14 2016
Stock Market Outlook: Chart Comments:
The SPX fell slightly on Wednesday although in mid-afternoon it took out the 2125 level and the 2120 level briefly before closing back at 2125. The action today left a neutral candlestick for Thursday.
All the major moving averages are continuing to climb but the 20 day is now falling rapidly and could shortly cross over the 50 day moving average which would be a short-term sell-signal.
The Bollinger Bands Squeeze from the summer months is now ended.
Stock Market Outlook: Support and Resistance Levels:
These are the present support and resistance levels.
The market was trying to build some support at the 2180 level. At present this is now resistance.
2160 was very light support.
2150 was support
2125 is light support.
2100 is light support.
2090 is very light support.
2075 is also light support
Below that is 2050 which is light support.
2025 is better support than 2050 through to 2090.
2000 is primary support.
Weak support is at 1970 while stronger support is at 1956 and technically it is more important than 1970 for the market. 1940 is light support as is 1920. 1900 is more symbolic than anything else.
Stock Market Outlook Technical Signals
Momentum: For momentum I use a 10 period when studying market direction. Momentum is negative and falling.
MACD Histogram: For MACD Histogram, I am using the Fast Points set at 13, Slow Points at 26 and Smoothing at 9. MACD (Moving Averages Convergence / Divergence) issued a sell signal on August 1. That sell signal was stronger on Wednesday indicating more downside lies ahead.
Ultimate Oscillator: The Ultimate Oscillator settings are: Period 1 is 5, Period 2 is 10, Period 3 is 15, Factor 1 is 4, Factor 2 is 2 and Factor 3 is 1. These are not the default settings but are the settings I use with the S&P 500 chart set for 1 to 3 months. The Ultimate Oscillator is negative and falling.
Rate of Change: Rate Of Change is set for a 21 period. The rate of change signal is negative and falling indicating lower prices are coming soon.
Slow Stochastic: For the Slow Stochastic I use the K period of 14 and D period of 3. The Slow Stochastic tries to predict the market direction further out than just one day. The Slow Stochastic has a down signal in place for Thursday and Friday.
Fast Stochastic: For the Fast Stochastic I use the K period of 20 and D period of 5. These are not default settings but settings I set for the 1 to 3 month S&P 500 chart when I have it set for daily views. The Fast Stochastic is signaling down for Thursday and is oversold.
Stock Market Outlook for Tomorrow – Sep 15 2016
For Thursday it would be great to say that the selling will stop and the market attempt another rally. However the technical indicators are all negative and continue to point to more downside ahead for stocks.
Thursday could see another rally attempt but it too should fail and the S&P will move lower, especially after breaking down to 2120 on Wednesday.
Caution is warranted following the decline on Tuesday that wiped out Monday’s rally. The hope for a short-term pullback now rests with the NASDAQ index which closed higher while the S&P and Dow closed negative on the day. Attention should be focused on the NASDAQ for Thursday.
Stay FullyInformed With Email Updates
Market Direction Internal Links
Profiting From Understanding Market Direction (Articles Index)
Understanding Short-Term Signals
Market Direction Portfolio Trades (Members)
Market Direction External Links
IWM ETF Russell 2000 Fund Info
Market Direction SPY ETF 500 Fund Info