
 Friday saw the markets drift sideways. Volume fell back on Friday and was unable to push the S&P through to retake 2190. However the S&P held onto the 2180 level and failed to break below it. All three indexes ended the day lower but losses were small.
S&P Index Close
The S&P index lost 5.22 points to close at 2181.90.
Dow Jones Index
The Dow Jones fell back 35.89 points to close at 18,867.93.
NASDAQ Index Close
The NASDAQ fell 12.46 points to close at 5,321.51.
Stock Market Outlook – Chart Comments At The Close
Stock Market Outlook – end of day Nov 18 2016
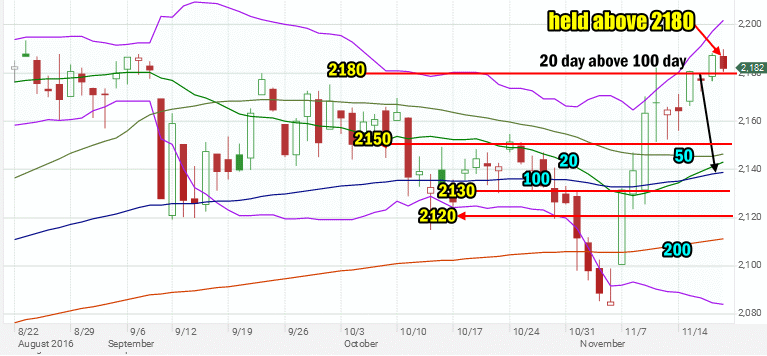
The S&P ended the day above the 2180 level but left behind a bearish candlestick for Monday.
The 20 day simple moving average (SMA) is continuing to advance toward the 50 day simple moving average (SMA). Meanwhile the S&P index is starting to move sideways as it moves away from the Upper Bollinger Band. The Upper Bollinger Band is not dipping back as of yet but a move lower by the S&P on Monday will see the Bollinger Bands begin to contract. At the close of trading on Friday however, the Bollinger Bands continues to signal more upside is ahead.
Stock Market Outlook: Technical Indicators Comments At Close:
Stock Market Outlook – Technical analysis for Nov 18 2016
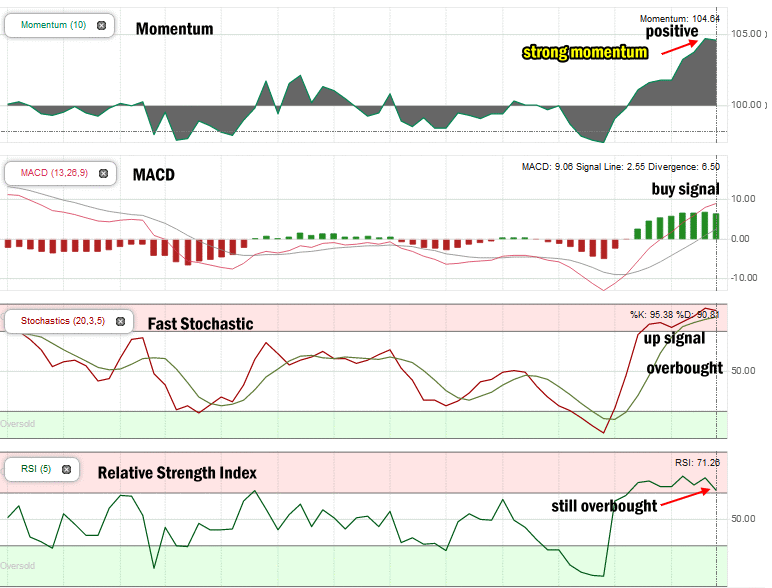
Momentum: For momentum I use a 10 period when studying market direction. Momentum is now at its highest level since July 11. Momentum on Friday did not climb but remained strongly positive.
MACD Histogram: For MACD Histogram, I am using the Fast Points set at 13, Slow Points at 26 and Smoothing at 9. MACD (Moving Averages Convergence / Divergence) issued a buy signal on Nov 9. The buy signal remains strong but as you can see in the chart it is not rising.
Fast Stochastic: For the Fast Stochastic I use the K period of 20 and D period of 5. These are not default settings but settings I use for the 1 to 3 month S&P 500 chart when I have it set for daily views. The Fast Stochastic is still signaling up and shows the market as extremely overbought. If there is more selling on Monday the Fast Stochastic will issue a sell signal.
Relative Strength Index (RSI) : For the Relative Strength Index (RSI) I use a period of 5 which is a week of activity and is often quite accurate. The RSI is still pointing to the market as extremely overbought which is often followed by a pullback. You can see that it is starting to turn down which could signal more weakness for Monday.
Stock Market Outlook technical indicators at close on Nov 18 2016
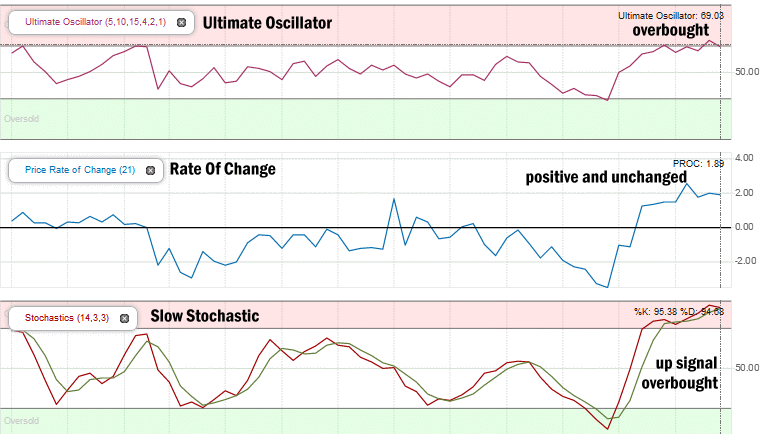
Ultimate Oscillator: The Ultimate Oscillator settings are: Period 1 is 5, Period 2 is 10, Period 3 is 15, Factor 1 is 4, Factor 2 is 2 and Factor 3 is 1. These are not the default settings but are the settings I use with the S&P 500 chart set for 1 to 3 months. The Ultimate Oscillator is still showing the market as overbought and is trending sideways.
Rate of Change: Rate Of Change is set for a 21 period. The rate of change signal is still positive but not rising. It is almost unchanged.
Slow Stochastic: For the Slow Stochastic I use the K period of 14 and D period of 3. The Slow Stochastic tries to predict the market direction further out than just one day. The Slow Stochastic has an up signal in place again for Monday. It is extremely overbought and the signals are so close that any amount of selling on Monday will see the Slow Stochastic issue a sell signal.
Stock Market Outlook for Tomorrow – Nov 21 2016
The rally has been strong and at times almost relentless, however its has also been uneven with the broad market not engaging in the rally. Friday was monthly options expiration which contributed to the sideways action, but volume was also down. This is a short week with Thursday being Thanksgiving the market is closed. Friday is half a day with markets closing at 1:00 PM.
Stocks have come a long way since Trump was elected President over a week ago and the rally is slowing considerably as the markets remain extremely overbought. Monday I am expecting some weakness to start the day but I am still anticipating a positive close despite being overbought.
Stay FullyInformed With Email Updates
Market Direction Internal Links
Profiting From Understanding Market Direction (Articles Index)
Understanding Short-Term Signals
Market Direction Portfolio Trades (Members)
Market Direction External Links
IWM ETF Russell 2000 Fund Info
Market Direction SPY ETF 500 Fund Info