
 Monday saw the rally stall a little as both the S&P and NASDAQ had trouble climbing and both ended the day with small losses. The Dow managed to squeak out another new high and gained 21.03 on the day. The real problem for equities is the US dollar which continues to strengthen in anticipation of what most believe will be inflationary policies of the new President.
The rise of the US dollar is pressuring bonds which are collapsing daily. At some point more stocks will notice the decline of bonds and react unfavorably.
S&P Index Close
The S&P index lost just 0.25 points marking a third day of sideways action. The close was 2,164.20.
Dow Jones Index
The Dow Jones moved higher adding 21.03 points to close at 18,868.69.
NASDAQ Index Close
The NASDAQ closed the day lower by 18.72 points to reach 5,218.40
Stock Market Outlook – Technical Indicators At The Close
Stock Market Outlook: Chart Comments:
The S&P continued its sideways pattern for a third day and was unable to recover the prior momentum which ended on Thursday when it managed to break through 2180 intraday before falling back.
The 20 day moving average which is still holding a sell signal on the market, has turned upward and is almost ready to cross up and over the 100 day moving average which would be a major buy signal. The 200 day moving average is continuing to climb after turning sideways early last week which warned that the market might pullback after the election. To date in the present rally, the S&P has been unable to break through the highs of early October.
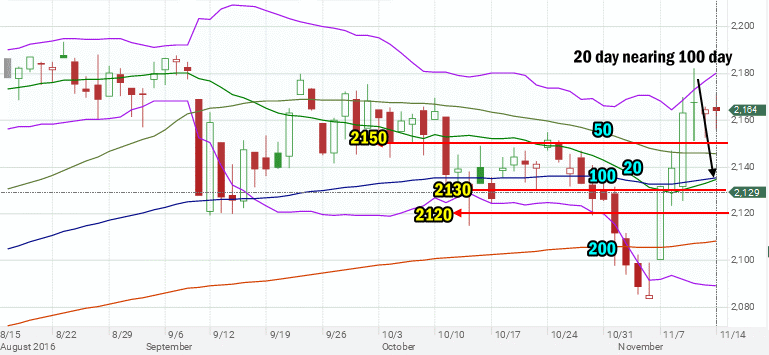
SPX to Nov 14 2016
Stock Market Outlook: Technical Indicators
Momentum: For momentum I use a 10 period when studying market direction. Momentum is positive and is now turning sideways. It indicates that the rally may be coming to an end or it may be taking a break before pushing higher.
MACD Histogram: For MACD Histogram, I am using the Fast Points set at 13, Slow Points at 26 and Smoothing at 9. MACD (Moving Averages Convergence / Divergence) issued a buy signal on Nov 9. The buy signal remains strong.
Fast Stochastic: For the Fast Stochastic I use the K period of 20 and D period of 5. These are not default settings but settings I use for the 1 to 3 month S&P 500 chart when I have it set for daily views. The Fast Stochastic is still signaling up but it shows the market is extremely overbought and it is turning down which indicates a sell signal could come as soon as Tuesday.
Relative Strength Index (RSI) : For the Relative Strength Index (RSI) I use a period of 5 which is a week of activity and is often quite accurate. The RSI is still pointing to the market as very overbought which often is followed by a pullback.
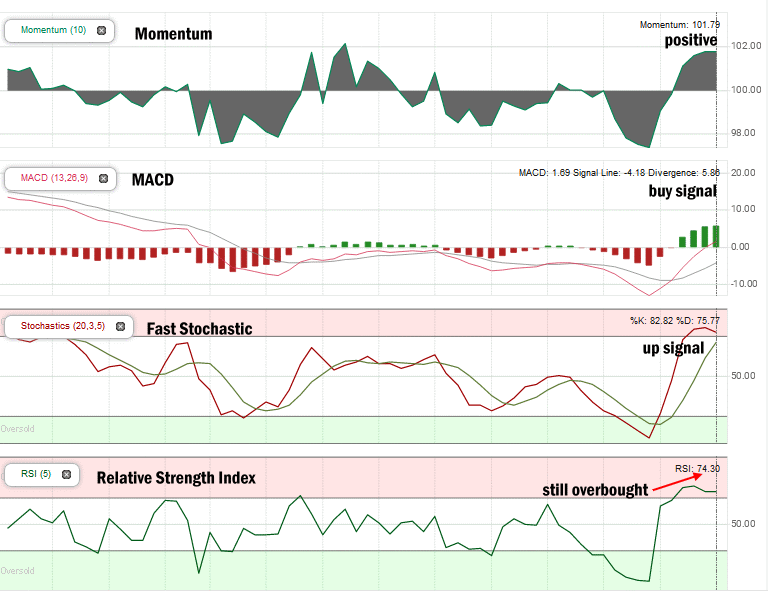
Technical Indicators – Nov 14 2016 at the close
Ultimate Oscillator: The Ultimate Oscillator settings are: Period 1 is 5, Period 2 is 10, Period 3 is 15, Factor 1 is 4, Factor 2 is 2 and Factor 3 is 1. These are not the default settings but are the settings I use with the S&P 500 chart set for 1 to 3 months. The Ultimate Oscillator is already showing the market as overbought but it is starting to turn lower.
Rate of Change: Rate Of Change is set for a 21 period. The rate of change signal is still positive and trying to climb higher.
Slow Stochastic: For the Slow Stochastic I use the K period of 14 and D period of 3. The Slow Stochastic tries to predict the market direction further out than just one day. The Slow Stochastic has down signal in place. As this indicator looks out longer than just one day, it is advising that shortly the S&P will move lower.
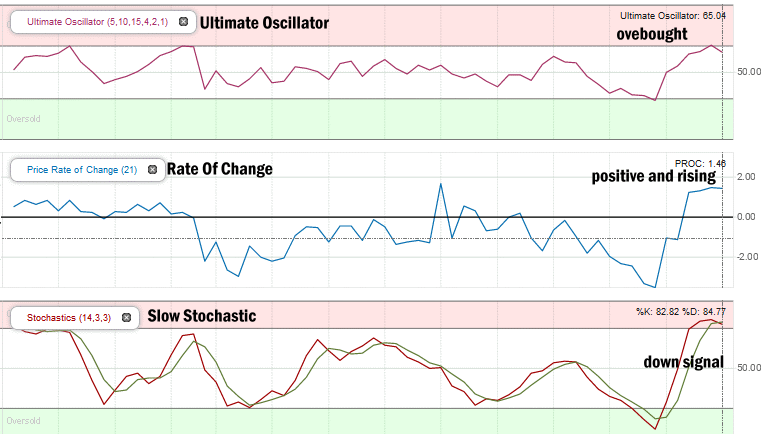
Technical Indicators – Nov 14 2016 at the close
Stock Market Outlook for Tomorrow – Nov 15 2016
With the S&P extremely overbought the technical indicators are divided. Five are positive and just the Slow Stochastic is negative. However there are signal from the other indicators that advise the rally may be coming to an end or certainly running “on empty”.
Overall the signal is one of an overbought market that does not want to fall back. Instead investors are taking some profits following the big move higher, which is a good idea for all investors after such a big run up for the Dow Jones.
With all three indexes still extremely overbought stocks should be ready to move a bit lower on Tuesday.
Stay FullyInformed With Email Updates
Market Direction Internal Links
Profiting From Understanding Market Direction (Articles Index)
Understanding Short-Term Signals
Market Direction Portfolio Trades (Members)
Market Direction External Links
IWM ETF Russell 2000 Fund Info
Market Direction SPY ETF 500 Fund Info