FullyInformed.com
Generic filters
Exact matches only
Search in title
Search in content
Search in excerpt

Stock Market Outlook for Monday Oct 3 2017 – Another Up Day

Oct 3, 2017 | Stock Market Outlook

Stock Market Outlook An Up Day

On Monday, all 3 indexes moved higher setting new records for yet another day. The first trading day of October historically has been poor. This was not the case on Monday with stocks soaring higher.

The Dow Jones in particular had an excellent day, moving higher by 0.68%.
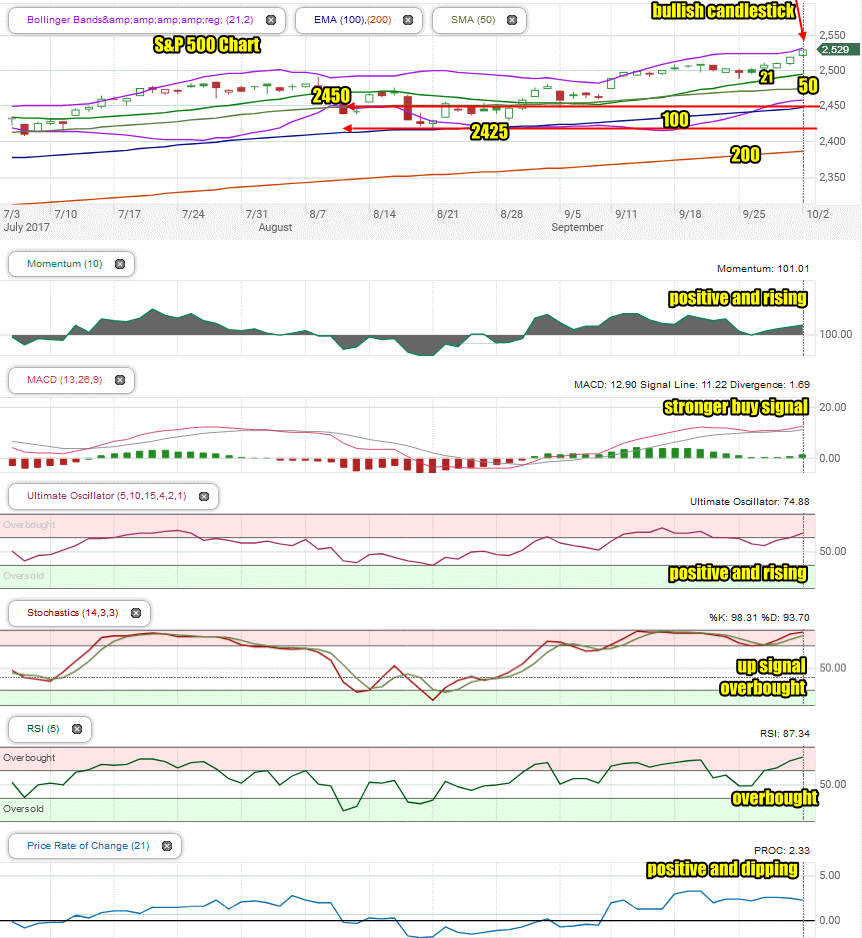
S&P 500 Index Close

The S&P index ended up 9.76 to 2529.12

Dow Jones Index Close

The Dow Jones ended up 152.51 to 22,557.60

NASDAQ Index Close

The NASDAQ closed up 20.76 to 6516.72


Stock Market Outlook

Stock Market Outlook review of Oct 2 2017

Chart Comments At The Close:

The S&P on Monday closed at the Upper Bollinger Band. It left behind a bullish candlestick for Tuesday.

The 21 day is continuing to climb. The 50 day is moving sideways which could prove problematic for the first week of October and needs to be watched to start the week.

The 100 and 200 day moving averages are continuing to rise which is bullish.

The Lower Bollinger Band is moving rapidly higher so we could see a Bollinger Bands Squeeze shortly although on Monday the Lower Bollinger Band began to turn sideways which might end the chance for a Bollinger Bands Squeeze. We will know more shortly.

Stock Market Outlook: Technical Indicators:

Momentum: For momentum I use a 10 period when studying market direction. Momentum is positive and rising.

MACD Histogram: For MACD Histogram, I am using the Fast Points set at 13, Slow Points at 26 and Smoothing at 9. MACD (Moving Averages Convergence / Divergence) issued a buy signal on Aug 31. The buy signal was stronger on Monday.

Ultimate Oscillator: The Ultimate Oscillator settings are: Period 1 is 5, Period 2 is 10, Period 3 is 15, Factor 1 is 4, Factor 2 is 2 and Factor 3 is 1. These are not the default settings but are the settings I use with the S&P 500 chart set for 1 to 3 months. The Ultimate Oscillator is positive and moving back toward being overbought.

Slow Stochastic: For the Slow Stochastic I use the K period of 14 and D period of 3. The Slow Stochastic tries to predict the market direction further out than just one day. The Slow Stochastic has an up signal in place and is extremely overbought.

Relative Strength Index: The relative strength index is set for a period of 5 which gives it 5 days of market movement to monitor.  It often is the first indicator to show an overbought or oversold signal.  The RSI signal is overbought.

Rate of Change: Rate Of Change is set for a 21 period. This indicator looks back 21 days and compares price action from the past to the present.  The rate of change signal is not climbing but starting to dip which could be an early signal that the market will take a break shortly.


Support Levels To Be Aware Of:

The S&P is trying to build support at 2480. It has light support at 2450 and good support at 2425. There is also light support at 2400, 2380, 2350 and 2300.


 Stock Market Outlook for Tomorrow – Tue Oct 3 2017

For Tuesday, the S&P looks set to try for another day of gains. The technical indicators are very overbought and that could spell some difficult for the markets.

Nonetheless, even if there is some weakness in the morning trading, the outlook remains up for the index.


Stay FullyInformed With Email Updates

 Market Direction Internal Links

Profiting From Understanding Market Direction (Articles Index)

How I Use Market Timing

How I Use Market Timing

Understanding Short-Term Signals

Various Market Timing Systems

Market Direction Portfolio Trades (Members)

Market Direction External Links

Market Direction

IWM ETF Russell 2000 Fund Info

Market Direction SPY ETF 500 Fund Info


Recent Outlooks

Stock Market Outlook For Thu May 7 2026 – Bullish and Still Higher

Prior Trading Day Summary On Wednesday stocks soared as strong earnings from Advanced Micro Devices Stock (AMD) sparked another rally. The SPX made another new intraday high as it reached 7369. The index closed up 106 points to end the …

Morning Investing Strategy Notes for Wed May 6 2026

For FullyInformed Members the morning Investing Strategy Notes for Wed May 6 2026 look at the rebound on Tuesday following Monday’s selling.. There are a large number of equities discussed in today’s morning Investing Strategy Notes. They include Palantir Tech …

Stock Market Outlook For Wed May 6 2026 – Choppy But Higher Still

Prior Trading Day Summary On Tuesday stocks again shook off Middle East worries and climbed higher. The SPX made another new intraday high as it reached 7273. The index closed up 58 points to end the day at 7259 on …

Morning Investing Strategy Notes for Tue May 5 2026

For FullyInformed Members the morning Investing Strategy Notes for Tue May 5 2026 look at the dip on Monday and the chance for another lower close today. There are a large number of equities discussed in today’s morning Investing Strategy …

Stock Market Outlook For Tue May 5 2026 – Overbought and Lower

Prior Trading Day Summary On Monday stocks saw some minor pressure and ended the day slightly lower. The SPX lost 29 points to close at 7200 on 5.2 billion shares traded. 63% of all stocks were falling by the close …

Morning Investing Strategy Notes for Mon May 4 2026

For FullyInformed Members the morning Investing Strategy Notes for Mon May 4 2026 look at the chance for a lower close. There are a large number of equities discussed in today’s morning Investing Strategy Notes. They include Palantir Tech Stock …

Stock Market Outlook For Mon May 4 2026 – Dips Likely With Possible Lower Close

Prior Trading Day Summary On Friday stocks continued to push higher on the back of better than estimated earnings from a number of large cap companies. With their stocks continuing to climb, stocks are once more extremely overbought. The SPX …

Morning Investing Strategy Notes for Fri May 1 2026

For FullyInformed Members the morning Investing Strategy Notes for Fri May 1 2026 look at the chance for another closing new high on Friday. There are a large number of equities discussed in today’s morning Investing Strategy Notes. They include …

Stock Market Outlook For Fri May 1 2026 – Overbought But Higher

Prior Trading Day Summary On Thursday earnings from a number of big cap stocks like Alphabet Stock (GOOGL) and Eli Lilly Stock (LLY) helped to push the indexes to new all-time highs yet again. The SPX rose 73 points to …

Morning Investing Strategy Notes for Thu Apr 30 2026

For FullyInformed Members the morning Investing Strategy Notes for Thu Apr 30 2026 look at the odds of a lower day. There are a large number of equities discussed in today’s morning Investing Strategy Notes. They include Alphabet Stock (GOOGL), …

Stock Market Outlook For Thu Apr 30 2026 – Dips Likely Possible Lower Close

Prior Trading Day Summary On Wednesday the SPX closed slightly lower while the NASDAQ closed higher ending the day with a mixed outlook. The SPX fell 3 points to close at 7135 on 5.2 billion shares traded. Just 37% of …

Morning Investing Strategy Notes for Wed Apr 29 2026

For FullyInformed Members the morning Investing Strategy Notes for Wed Apr 29 2026 look at expectations for profits on Wednesday and especially Thursday. There are a large number of equities discussed in today’s morning Investing Strategy Notes. They include Nucor …

Stock Market Outlook For Wed Apr 29 2026 – Choppy But Higher Ahead Of More Earnings

Prior Trading Day Summary On Tuesday both the SPX and NASDAQ lost a little ground but the bigger earnings are set to be released starting tomorrow. The SPX fell 35 points to close at 7178 on 5 billion shares traded …

Morning Investing Strategy Notes for Tue Apr 28 2026

For FullyInformed Members the morning Investing Strategy Notes for Tue Apr 28 2026 look at anticipated market action for today. There are a number of equities discussed in today’s morning Investing Strategy Notes. They include Intel Stock (INTC), Nucor Stock …

Subscribe For The Latest News