

Friday saw another mammoth rally with the S&P rallying a further 93 points to close at 3901. The NASDAQ climbed 309 points closing the day at 11,102 despite drops in Amazon.com and AbbVie Stock (ABBV). Meta Stock (META) and Apple stock initially dipped but then moved higher. Apple close up almost $11 at $155.74.
Investors are of the belief the Fed is nearing an end or a pause to interest rate hikes. This week we get the next interest rate increase from the Fed and investors will be watching for hints of a slowing or pausing of further rate increases.
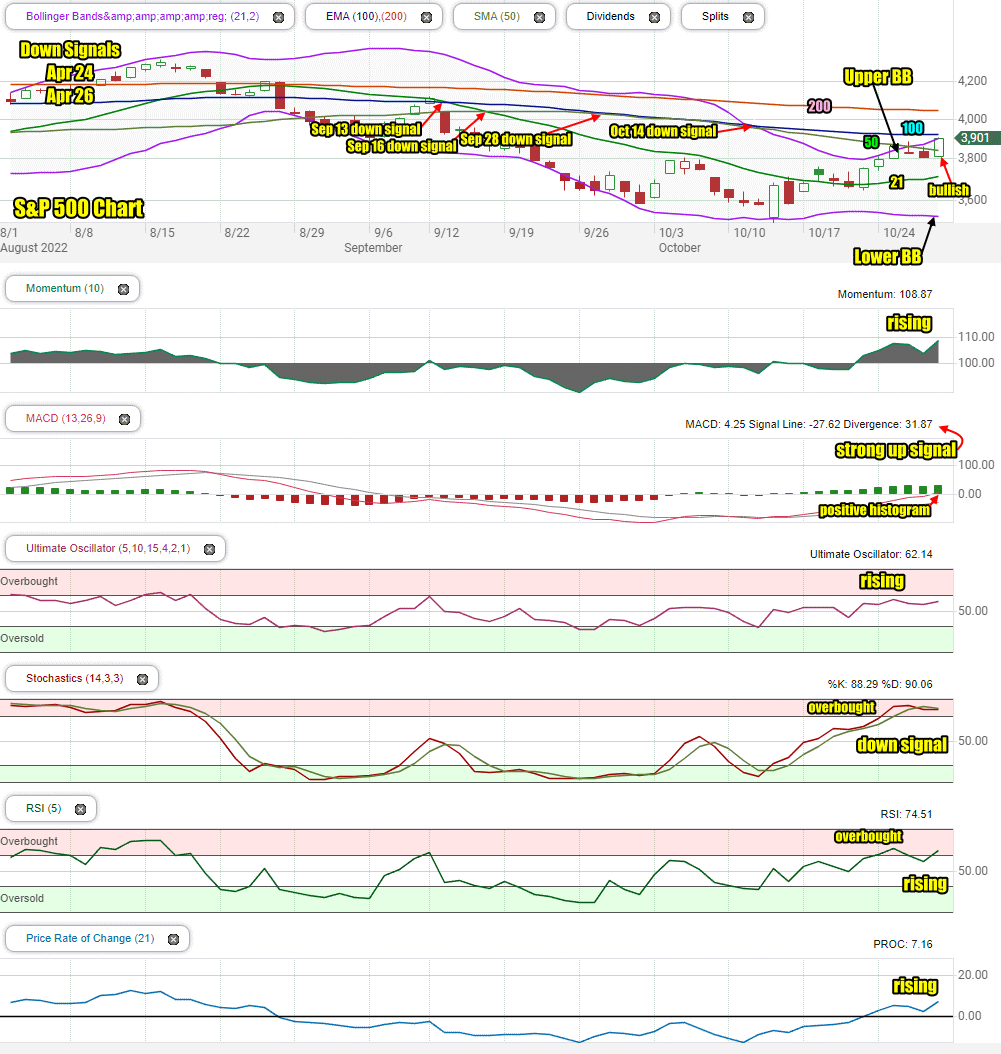
Let’s review the closing technical indicators from Fri Oct 18 2022 to see what to expect for Mon Oct 31 2022.
Stock Market Outlook Chart Comments At The Close on Fri Oct 28 2022
On Friday the S&P closing candlestick was above the 50 day moving average and nearing the 100 day. The candlestick is bullish for Monday.
The Bollinger Bands Squeeze is ended and the Upper Bollinger Band has turned back up and is above the 50 day moving average which is bullish.
The Lower Bollinger Band is trending sideways which is neutral.
The 21 day moving average is moving higher which is bullish.
All the remaining moving averages are still falling which is bearish.
There are 7 down signals in place since April and no up signals but the chart is more bullish than it has been in two months.
The chart is only 50% bearish for Monday.
Stock Market Outlook review of Fri Oct 28 2022
Stock Market Outlook: Technical Indicators Review:
Momentum: Momentum is rising and positive.
- Settings: For momentum I use a 10 period when studying market direction.
MACD Histogram: MACD (Moving Averages Convergence / Divergence) issued an up signal on Thursday Oct 16. On Friday the up signal had a large increase in strength. The histogram also gained strength.
- Settings: For MACD Histogram, I am using the Fast Points set at 13, Slow Points at 26 and Smoothing at 9.
Ultimate Oscillator: The Ultimate Oscillator is rising and positive.
- Settings: The Ultimate Oscillator settings are: Period 1 is 5, Period 2 is 10, Period 3 is 15, Factor 1 is 4, Factor 2 is 2 and Factor 3 is 1. These are not the default settings but are the settings I use with the S&P 500 chart set for 1 to 3 months.
Slow Stochastic: The Slow Stochastic has a down signal in place and is still signaling overbought.
Settings: For the Slow Stochastic I use the K period of 14 and D period of 3. The Slow Stochastic tries to predict the market direction further out than just one day.
Relative Strength Index: The RSI signal is rising and into overbought signals.
- Settings: The relative strength index is set for a period of 5 which gives it 5 days of market movement to monitor. It is often the first indicator to show an overbought or oversold signal.
Rate of Change: The rate of change signal is rising and positive.
- Settings: Rate Of Change is set for a 21 period. This indicator looks back 21 days and compares price action from the past to the present. With the Rate Of Change, prices are rising when signals are positive. Conversely, prices are falling when signals are negative. As an advance rises the Rate Of Change signal should also rise higher, otherwise the rally is suspect. A decline should see the Rate Of Change fall into negative signals. The more negative the signals the stronger the decline.
Support and Resistance Levels To Be Aware Of:
4000 is resistance
3975 is resistance
3965 is resistance
3950 is resistance
3925 is resistance
3900 is resistance
3875 is resistance
3850 is resistance
3825 is resistance
3800 is resistance
3775 is light resistance
3750 is light resistance
3730 is light support
3700 is light support
3675 is light support
3650 is light support
Stock Market Outlook for Tomorrow – Mon Oct 31 2022
For Monday the technical indicators are a bit mixed but certainly strong enough to suggest Monday will see some dips but still end higher.
You can see in the support and resistance levels, the index is heading into a series of resistance bands. However as the market showed on Friday, short sellers have been quick to cover positions which assisted the rally. There is a good chance we will see more short covering this week but after 3950, the S&P should see some selling and a tougher push ahead.
For Monday I expect a choppy day with dips back below 3900 but a higher close.
Potential Market Moving Events
There are a number of events this week but the big event is Wed Nov 2 at 2:00 PM when Fed Chair Powell announces the latest interest rate.
Monday:
9:45 Chicago PMI is expected to come in at 47.
Stock Market Outlook Archives
Stock Market Outlook For Wed May 6 2026 – Choppy But Higher Still

Morning Investing Strategy Notes for Tue May 5 2026

Stock Market Outlook For Tue May 5 2026 – Overbought and Lower

Morning Investing Strategy Notes for Mon May 4 2026
Stock Market Outlook For Mon May 4 2026 – Dips Likely With Possible Lower Close

Morning Investing Strategy Notes for Fri May 1 2026
Stock Market Outlook For Fri May 1 2026 – Overbought But Higher

Morning Investing Strategy Notes for Thu Apr 30 2026
Stock Market Outlook For Thu Apr 30 2026 – Dips Likely Possible Lower Close
Morning Investing Strategy Notes for Wed Apr 29 2026
Stock Market Outlook For Wed Apr 29 2026 – Choppy But Higher Ahead Of More Earnings

Morning Investing Strategy Notes for Tue Apr 28 2026