Friday saw all 3 indexes try to push higher in the morning but run into sellers later in the morning. By the close on Friday investors turned very bearish. The SPX broke through 3600 with less than 15 minutes left in the day. Volume jumped as the SPX Feb lower to close at 3585, a new closing low for the bear market. The NASDAQ closed down 161 points to end the day at 10,575.
Stocks are still very oversold but buyers are reluctant to step into stocks at present which continues to lead the indexes lower. On Monday we start into October which has a nasty history of market plunges but also a history of ending bear markets. While October has indeed seen a number of market crashes it is actually September that is the worse month almost annually for stocks. Historically the first trading day of October has been weak for stocks.
Let’s review the close on Friday to see if history will repeat again on Monday.
Stock Market Outlook Chart Comments At The Close on Fri Sep 30 2022
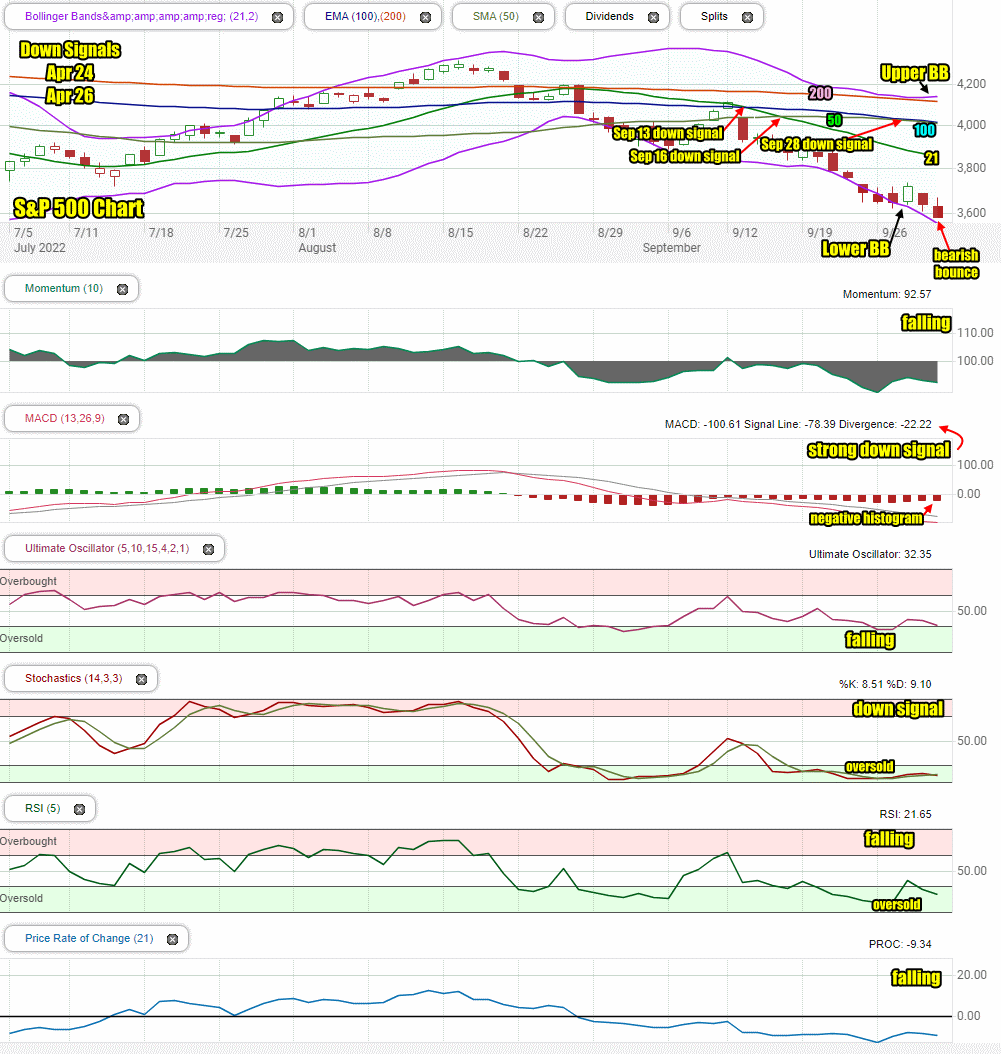
At the close of trading the S&P closing candlestick is once again signaling lower but with the potential for a bounce as markets remain deeply oversold.
The 21 day moving average continued its descent and the 100 day continued moving lower below the 50 day. Both are bearish signals.
The Upper Bollinger Band is rising and failed to fall below the 200 day moving average. This is bullish and suggests another bounce attempt might be in the works for the start of the week. The Lower Bollinger Band is still falling sharply indicating stocks have not yet bottomed.
All the moving averages are still falling which is bearish.
There are now 5 down signals in place since April and no up signals.
The chart is 90% bearish for Monday with only the closing candlestick and the Upper Bollinger Band suggesting the index could try to bounce.
Stock Market Outlook review of Fri Sep 30 2022
Stock Market Outlook: Technical Indicators Review:
Momentum: Momentum is falling and negative.
- Settings: For momentum I use a 10 period when studying market direction.
MACD Histogram: MACD (Moving Averages Convergence / Divergence) issued a down signal on Monday Aug 22. On Friday the down signal gained strength. The histogram also gained strength. Both signals are very bearish and at levels where a bounce can happen at any time.
- Settings: For MACD Histogram, I am using the Fast Points set at 13, Slow Points at 26 and Smoothing at 9.
Ultimate Oscillator: The Ultimate Oscillator is falling and still negative. It is back at oversold readings.
- Settings: The Ultimate Oscillator settings are: Period 1 is 5, Period 2 is 10, Period 3 is 15, Factor 1 is 4, Factor 2 is 2 and Factor 3 is 1. These are not the default settings but are the settings I use with the S&P 500 chart set for 1 to 3 months.
Slow Stochastic: The Slow Stochastic has a down signal in place. Signals are still at readings we saw in mid-June before the market bounced. The indicator is signaling oversold.
Settings: For the Slow Stochastic I use the K period of 14 and D period of 3. The Slow Stochastic tries to predict the market direction further out than just one day.
Relative Strength Index: The RSI signal is falling and back into oversold readings.
- Settings: The relative strength index is set for a period of 5 which gives it 5 days of market movement to monitor. It is often the first indicator to show an overbought or oversold signal.
Rate of Change: The rate of change signal is falling slightly.
- Settings: Rate Of Change is set for a 21 period. This indicator looks back 21 days and compares price action from the past to the present. With the Rate Of Change, prices are rising when signals are positive. Conversely, prices are falling when signals are negative. As an advance rises the Rate Of Change signal should also rise higher, otherwise the rally is suspect. A decline should see the Rate Of Change fall into negative signals. The more negative the signals the stronger the decline.
Support and Resistance Levels To Be Aware Of:
3800 is light resistance
3775 is light resistance
3750 is light resistance
3730 is light resistance
3700 is good support
3675 is light support
3650 is light support
3625 is light support
3600 is good support and is a decline of 25%
3585 is light support
3550 is good support
3530 is light support
3515 is light support
3500 is good support and is a decline of 27%
Stock Market Outlook for Tomorrow – Mon Oct 3 2022
For Monday I am expecting a push to move back above 3600, perhaps several times intraday but technical indicators are advising that investors should expect a lower close.
Markets remain extremely oversold. It won’t take much to bounce stocks higher. A lower inflation report would definitely bounce stocks and on Friday we get September’s unemployment report. Any sign of a rise in unemployment should shoot stocks higher. For that reason while Monday could be lower, a bounce can happen at any time. For much of this week I am expecting weakness but nothing dramatic until we get the unemployment numbers on Friday. I will be putting together a SPY ETF trade on Thursday ahead of the September jobs numbers.
Potential Market Moving Events
The biggest market moving event for the week is Friday’s September non-farm payrolls.
Monday:
9:45 US manufacturing PMI
10:00 Construction spending
various: Auto sales
3:10 NY Fed John Williams speaks. I am not expecting anything dramatic but watch for any comments that could send stocks down or up in the final half hour of the day.
Stock Market Outlook Archives
Stock Market Outlook for Thu Apr 18 2024 – Deeply Oversold – Bounce Attempt Expected

Morning Investing Strategy Notes for Wed Apr 17 2024

Stock Market Outlook for Wed Apr 17 2024 – Another Bounce Attempt

Morning Investing Strategy Notes for Tue Apr 16 2024

Stock Market Outlook for Tue Apr 16 2024 – Deeply Oversold

Morning Investing Strategy Notes for Mon Apr 15 2024

Stock Market Outlook for Mon Apr 15 2024 – Expect A Bounce
Morning Investing Strategy Notes for Fri Apr 12 2024

Stock Market Outlook for Fri Apr 12 2024 – All About Bank Earnings

Morning Investing Strategy Notes for Thu Apr 11 2024

Stock Market Outlook for Thu Apr 11 2024 – Weakness and Lower

Morning Investing Strategy Notes for Wed Apr 10 2024

Stock Market Outlook for Wed Apr 10 2024 – All About The CPI Numbers

Morning Investing Strategy Notes for Tue Apr 9 2024

Stock Market Outlook for Tue Apr 9 2024 – Morning Weakness Possible But Higher Close
