
Prior Trading Day Summary
On Fri Oct 24 2025 stocks had another strong session setting new highs in all 3 indexes.
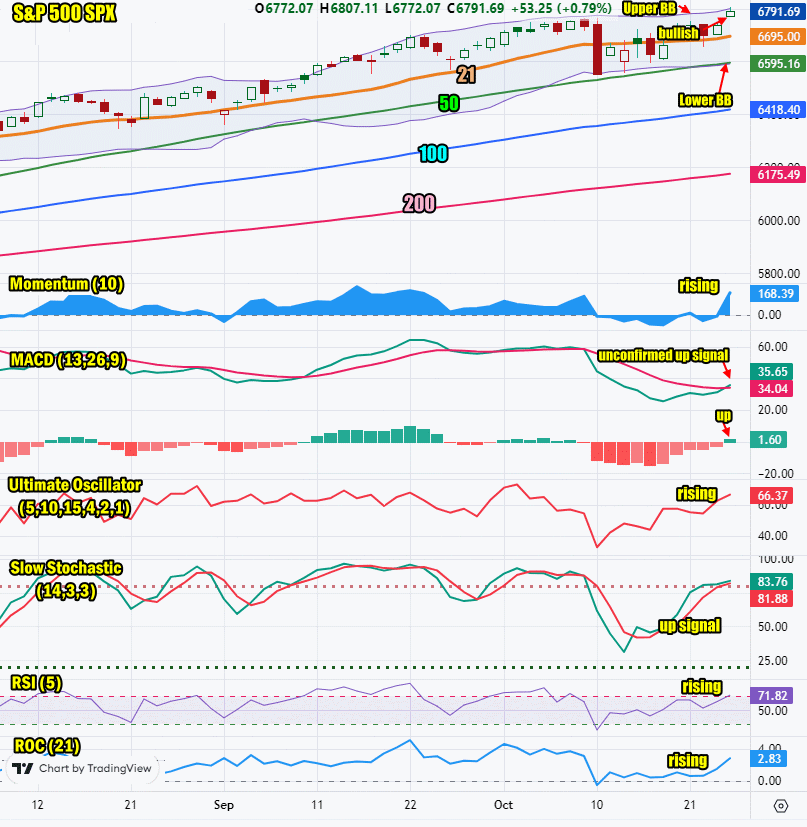
The SPX rose 53 points to close at 6791 while intraday the index traded above 6800. Volume was 5.1 billion shares which was good volume. 61% of all stocks were rising by the close on Friday. For the week the index was up 127 points.
The NASDAQ rose 263 points to close at 23,204. Volume was higher by 300 million shares to 10.7 billion. 67% of all stocks were rising by close. For the week the NASDAQ added 524 points.
The VIX index closed lower at 16.37.
Lets review the closing technical indicators from Fri Oct 24 2025 to see what investors should expect on Mon Oct 27 2025 for the final week of October.
Stock Market Outlook: SPX Closing Chart For Fri Oct 24 2025
The index closed at the Upper Bollinger Band. This is a bullish signal.
The closing candlestick is bullish for Monday but with a small shadow which signals some weakness today, probably in the morning.
The 21 day moving average is rising and closed at 6695 which is bullish.
The 50 day moving average is rising and closed at 6595 which is bullish.
The 100 day moving average is rising and closed at 6418 which is bullish.
The 200 day moving average is rising and closed at 6175 which is bullish.
The Lower Bollinger Band is just above the 50 day moving average which is bullish. The Upper Bollinger Band is moving higher which is bullish.
The SPX chart is bullish. All moving averages are above 6100 which is bullish for further advances.
SPX Stock Market Outlook review of Fri Oct 24 2025
Stock Market Outlook: Technical Indicators Review
Momentum: Momentum is rising and positive.
|
MACD Histogram: MACD (Moving Averages Convergence / Divergence) issued a down signal on Thu Oct 9 2025. On Friday a new unconfirmed up signal was generated by the close.
|
Ultimate Oscillator: The Ultimate Oscillator is rising.
|
Slow Stochastic: The Slow Stochastic has an up signal in place and is overbought.
|
Relative Strength Index: The RSI signal is rising.
|
| Rate of Change: The rate of change is rising. It is signaling a higher close for Monday. Settings: Rate Of Change is set for a 21 period. This indicator looks back 21 days and compares price action from the past to the present. With the Rate Of Change, prices are rising when signals are positive. Conversely, prices are falling when signals are negative. As an advance rises, the Rate Of Change signal should also rise higher, otherwise the rally is suspect. A decline should see the Rate Of Change fall into negative signals. The more negative the signals the stronger the decline. |
Stock Market Outlook: Support and Resistance Levels |
| 6800 is resistance |
| 6775 is resistance |
| 6750 is resistance |
| 6715 is resistance |
| 6700 is resistance |
| 6675 is resistance |
| 6650 is resistance |
| 6625 is resistance |
| 6600 is resistance |
| 6590 is resistance |
| 6570 is resistance |
| 6550 is support |
| 6500 is support |
| 6450 is support |
| 6425 is support |
| 6400 is support |
| 6350 is support |
| 6325 is support |
| 6300 is support |
| 6250 is support |
| 6225 is support |
| 6200 is support |
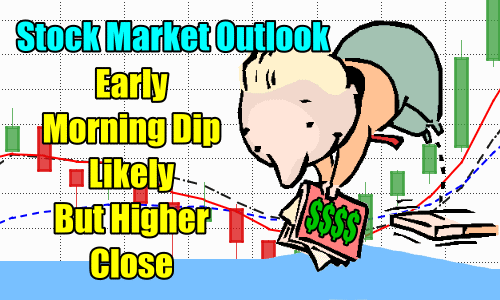
Stock Market Outlook for Mon Oct 27 2025
On Monday stocks start the day with a new unconfirmed up signal from the MACD technical indicator. This is one of the more accurate indicators. The up signal needs to be confirmed but at present the other technical indicators are all rising and signaling a higher close on Monday.
This is a big week for stocks with more earnings due out but in particular, the Fed decision on interest rates which at present, analysts believe will see another quarter point decrease. The day looks like we could see a dip in the morning but a higher close should be the outcome.
Potential Economic and Political Market Moving Events
Monday:
No reports will be released today due to the ongoing government shutdown.