

Friday’s rally added another 33 points and was steady for the entire day. At the close the SPX had recovered most of the latest correction and was at levels not seen since Sep 16. The index closed above all major moving averages.
Let’s review Fri Oct 15 2021 closing technicals and see what to expect to start the week.
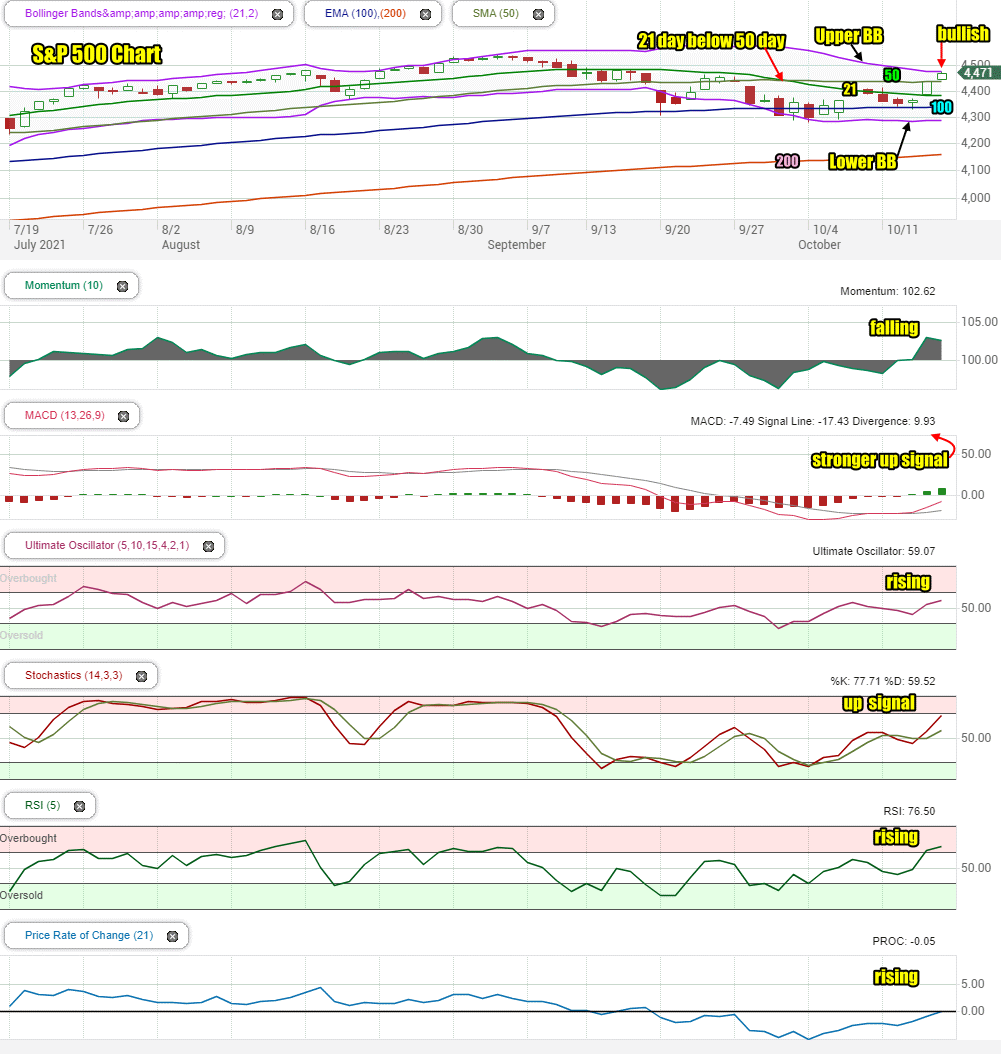
Stock Market Outlook Chart Comments At The Close on Fri Oct 15 2021
Friday saw the index close above the 50 day moving average and at the Upper Bollinger Band. This is bullish. Another move higher this week will turn the Upper Bollinger Band up which is another bullish signal.
The closing candlestick on Friday is bullish for Monday but also points to morning weakness to start the day.
The 21 day moving average which fell below the 50 day last week, is continuing to fall and is still below the 4400 level which is bearish.
The 50 day is trending sideways which is more neutral than bearish.
The 100 and 200 day moving averages are starting to trend sideways which is neutral to bullish.
For Monday there are more bullish signals than bearish to start the week.
Stock market outlook review of Fri Oct 15 2021
Stock Market Outlook: Technical Indicators Review:
Momentum: Momentum is falling but positive.
- Settings: For momentum I use a 10 period when studying market direction.
MACD Histogram: MACD (Moving Averages Convergence / Divergence) issued an up signal on Wed Oct 13 2021 . On Fri Oct 15 the up signal was much stronger which indicates more upside ahead for the index this week.
- Settings: For MACD Histogram, I am using the Fast Points set at 13, Slow Points at 26 and Smoothing at 9.
Ultimate Oscillator: The Ultimate Oscillator is rising and positive.
- Settings: The Ultimate Oscillator settings are: Period 1 is 5, Period 2 is 10, Period 3 is 15, Factor 1 is 4, Factor 2 is 2 and Factor 3 is 1. These are not the default settings but are the settings I use with the S&P 500 chart set for 1 to 3 months.
Slow Stochastic: The Slow Stochastic has an up signal in place.
Settings: For the Slow Stochastic I use the K period of 14 and D period of 3. The Slow Stochastic tries to predict the market direction further out than just one day.
Relative Strength Index: The RSI signal is rising for a third da and starting to enter overbought readings.
- Settings: The relative strength index is set for a period of 5 which gives it 5 days of market movement to monitor. It is often the first indicator to show an overbought or oversold signal.
Rate of Change: The rate of change signal is rising for a third day.
- Settings: Rate Of Change is set for a 21 period. This indicator looks back 21 days and compares price action from the past to the present. With the Rate Of Change, prices are rising when signals are positive. Conversely, prices are falling when signals are negative. As an advance rises the Rate Of Change signal should also rise higher, otherwise the rally is suspect. A decline should see the Rate Of Change fall into negative signals. The more negative the signals the stronger the decline.
Support and Resistance Levels To Be Aware Of:
4550 is resistance
4525 is resistance
4500 is resistance
4490 is resistance
4475 is resistance
4450 is support
4400 is support
4370 is light support
4350 is light support
4300 is light support
4290 is light support
4270 is light support
4250 is good support
4225 is light support
4200 is good support
4175 is light support
4150 is light support
4100 is good support
Stock Market Outlook for Tomorrow – Mon Oct 18 2021
For Monday, investors should expect a dip in the morning, either at or near the start of mid-morning.
The technical indicators are gaining strength to the upside and MACD has a strong up reading in place. Monday will see the index end higher on the day.
On Monday, on any dips, especially in the morning, I will be buying SPY ETF calls.
Stock Market Outlook Archives
Stock Market Outlook For Wed May 6 2026 – Choppy But Higher Still

Morning Investing Strategy Notes for Tue May 5 2026

Stock Market Outlook For Tue May 5 2026 – Overbought and Lower

Morning Investing Strategy Notes for Mon May 4 2026
Stock Market Outlook For Mon May 4 2026 – Dips Likely With Possible Lower Close

Morning Investing Strategy Notes for Fri May 1 2026
Stock Market Outlook For Fri May 1 2026 – Overbought But Higher

Morning Investing Strategy Notes for Thu Apr 30 2026
Stock Market Outlook For Thu Apr 30 2026 – Dips Likely Possible Lower Close
Morning Investing Strategy Notes for Wed Apr 29 2026
Stock Market Outlook For Wed Apr 29 2026 – Choppy But Higher Ahead Of More Earnings

Morning Investing Strategy Notes for Tue Apr 28 2026