

The September non-farm payrolls came in stronger than estimates at 263,000 and the unemployment rate dipped to 3.5%. These numbers show a strong economy. Strong enough to keep the Fed on course with further rate increases into at least the end of the year unless something “out of the blue” should alter the Fed’s course of action. At present that seems unlikely. For that reason stocks plunges on Friday. 90% of all volume on the SPX was being traded to the downside and 86% on the NASDAQ. This is directly opposite of Tuesday last week when 95% of all volume on the SPX was to the upside and 91% on the NASDAQ. The numbers caught investors and analysts by surprise. Few expected the drop. Luckily I had a SPY trade in place from Thursday set to profit from up or down movement. Suffice to say, it was highly profitable on Friday.
The SPX lost 104 points to close at 3639 on Friday but was positive for the week by 54 points. The NASDAQ lost 421 points to close at 10,652 but was positive on the week for 76 points. Overall though it was a dismal end of the week and the gains made on Friday look set to be given back on Monday.
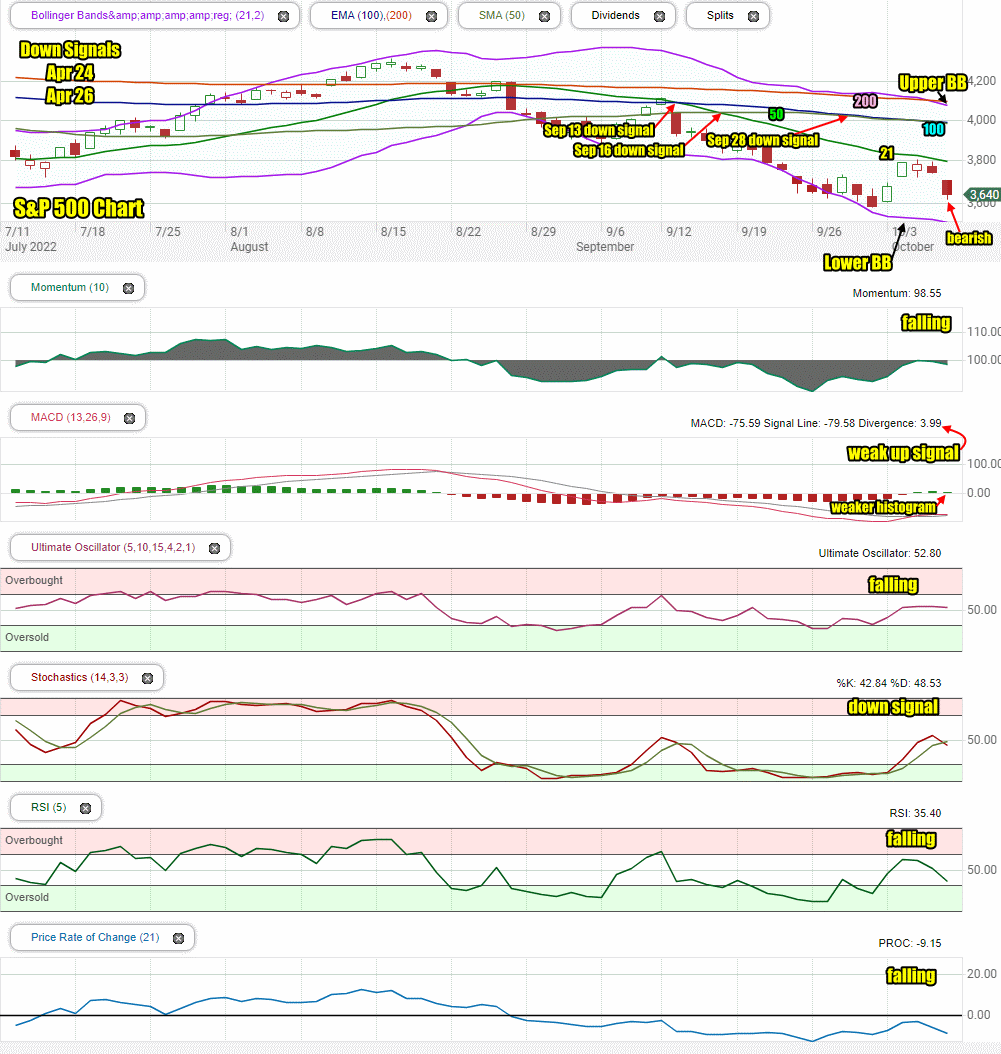
Let’s review Friday’s closing technical indicators to see what to expect for the start of the second week of October.
Stock Market Outlook Chart Comments At The Close on Fri Oct 7 2022
At the close of trading the S&P closing candlestick is bearish for Monday. The closing candlestick is well below the 21 day moving average and falling toward the Lower Bollinger Band. It signals the market is oversold but gives little evidence a bounce will occur on Monday.
The 21 day moving average continued its descent and the 100 day continued moving lower below the 50 day. Both are bearish signals.
Another down signal on Friday as the Upper Bollinger Band broke below the 200 day moving average. This is bearish and signals stocks will move lower. The Lower Bollinger Band is falling. This is also bearish.
All the moving averages are still falling which is bearish.
There are now 6 down signals in place since April and no up signals.
The chart is 100% bearish for Monday. A bearish signal this strong has a good chance of seeing the index dip lower on Monday but intraday, depending on how strong the down move is, could see a bounce attempt to hold onto the 3600 valuation. On Monday though a close below 3600 seems highly likely.
Stock Market Outlook review of Fri Oct 7 2022
Stock Market Outlook: Technical Indicators Review:
Momentum: Momentum is falling and negative.
- Settings: For momentum I use a 10 period when studying market direction.
MACD Histogram: MACD (Moving Averages Convergence / Divergence) issued an up signal on Wednesday Oct 5 2022 . On Friday the up signal was cut in half. The histogram also lost strength on Friday.
- Settings: For MACD Histogram, I am using the Fast Points set at 13, Slow Points at 26 and Smoothing at 9.
Ultimate Oscillator: The Ultimate Oscillator is falling but positive.
- Settings: The Ultimate Oscillator settings are: Period 1 is 5, Period 2 is 10, Period 3 is 15, Factor 1 is 4, Factor 2 is 2 and Factor 3 is 1. These are not the default settings but are the settings I use with the S&P 500 chart set for 1 to 3 months.
Slow Stochastic: The Slow Stochastic has a down signal in place.
Settings: For the Slow Stochastic I use the K period of 14 and D period of 3. The Slow Stochastic tries to predict the market direction further out than just one day.
Relative Strength Index: The RSI signal is falling and negative.
- Settings: The relative strength index is set for a period of 5 which gives it 5 days of market movement to monitor. It is often the first indicator to show an overbought or oversold signal.
Rate of Change: The rate of change signal is falling and negative.
- Settings: Rate Of Change is set for a 21 period. This indicator looks back 21 days and compares price action from the past to the present. With the Rate Of Change, prices are rising when signals are positive. Conversely, prices are falling when signals are negative. As an advance rises the Rate Of Change signal should also rise higher, otherwise the rally is suspect. A decline should see the Rate Of Change fall into negative signals. The more negative the signals the stronger the decline.
Support and Resistance Levels To Be Aware Of:
4000 is light resistance
3975 is light resistance and is a decline of 17.5%
3950 is llight resistance
3925 is llight resistance
3900 is good resistance
3875 is light resistance
3850 is light resistance
3825 is light resistance
3810 is light resistance
3800 is resistance
3775 is light resistance
3750 is light resistance
3730 is light resistance
3700 is good support
3675 is light support
3650 is light support
3625 is light support
3600 is good support and is a decline of 25%
3585 is light support
3550 is good support
3530 is light support
3515 is light support
3500 is good support and is a decline of 27%
Stock Market Outlook for Tomorrow – Mon Oct 10 2022
For Monday the index should open lower and move lower, probably below 3600, before any bounce attempt. While a bounce would be great to see, the close has a high probability of being below 3600. Stocks are very oversold and the technical indicators are signaling that stocks are again falling steadily. However stocks are not extremely oversold as they were when the market bounce early last week. For that reason, the index has more room to fall before reaching an extremely oversold signal again. Any bounces, especially to start the week, should be considered highly suspect unless there are actual signals of a change in Fed policy. That seems unlikely, therefore I will be using any bounces to buy SPY put options for a move that probably will see the SPX down to 3500 this week.
Potential Market Moving Events
There are a number of economic reports this week dealing with inflation. The index is setting up for a volatile week. Wednesday investors get the FOMC latest minutes at 2:00 PM. That will move markets. Market direction trades should do well this week.
Monday:
Two Feds are speaking but none should move markets higher.
Tuesday:
6:00 NFIB small-business index
11:00 NY Fed 5 year inflation expectations
Stock Market Outlook Archives
Stock Market Outlook For Wed May 6 2026 – Choppy But Higher Still

Morning Investing Strategy Notes for Tue May 5 2026

Stock Market Outlook For Tue May 5 2026 – Overbought and Lower

Morning Investing Strategy Notes for Mon May 4 2026
Stock Market Outlook For Mon May 4 2026 – Dips Likely With Possible Lower Close

Morning Investing Strategy Notes for Fri May 1 2026
Stock Market Outlook For Fri May 1 2026 – Overbought But Higher

Morning Investing Strategy Notes for Thu Apr 30 2026
Stock Market Outlook For Thu Apr 30 2026 – Dips Likely Possible Lower Close
Morning Investing Strategy Notes for Wed Apr 29 2026
Stock Market Outlook For Wed Apr 29 2026 – Choppy But Higher Ahead Of More Earnings

Morning Investing Strategy Notes for Tue Apr 28 2026