
On Friday Nov 25, volumes were anemic thanks to the shortened day of trading and the Thanksgiving long holiday weekend.
The S&P ended the day flat, with a loss of just 1 point to close at 4026. Volume was just 1.7 billion shares.
The NASDAQ ended lower by 59 points to 11,226 on volume of only 2.2 billion or less than half a normal day’s volume.
Protests in China have Asian markets on edge to start the final week of November but Black Friday retails sales were better than estimated here at home. Monday could prove quite interesting.
Let’s review the closing SPX technical indicators from Friday despite the lack of volume to see what we might see on Monday.
Stock Market Outlook Chart Comments At The Close on Fri Nov 25 2022
On Friday the S&P closing candlestick is at the 200 day moving average. The candlestick is bullish for Monday despite the lack of volume.
The closing candlestick is still above the 21, 50 and 100 day moving averages which is bullish.
The Upper Bollinger Band crossed above the 200 day on Wednesday November 16 which is a bullish signal. It is continuing to move higher.
The Lower Bollinger Band is turning sideways. This is bullish and could indicate the rally will extend into this week.
A new up signal was generated on Friday Nov 11 as the 21 day moving average is back above the 50 day. This is bullish. The 21 day is continuing to rise and is nearing the 100 day moving average.
The 50, 100 and 200 day moving averages are all turning sideways which is bullish.
There are 6 down signals in place since April and one up signal.
The chart is 75% bullish for Monday.

Stock Market Outlook review of Fri Nov 25 2022
Stock Market Outlook: Technical Indicators Review:
Momentum: Momentum is falling and positive.
- Settings: For momentum I use a 10 period when studying market direction.
MACD Histogram: MACD (Moving Averages Convergence / Divergence) issued an up signal on Thursday Oct 16. On Friday the up signal remained bullish but was again weaker. The histogram also has a positive signal.
- Settings: For MACD Histogram, I am using the Fast Points set at 13, Slow Points at 26 and Smoothing at 9.
Ultimate Oscillator: The Ultimate Oscillator is falling and is signaling overbought.
- Settings: The Ultimate Oscillator settings are: Period 1 is 5, Period 2 is 10, Period 3 is 15, Factor 1 is 4, Factor 2 is 2 and Factor 3 is 1. These are not the default settings but are the settings I use with the S&P 500 chart set for 1 to 3 months.
Slow Stochastic: The Slow Stochastic has an up signal in place and is overbought.
Settings: For the Slow Stochastic I use the K period of 14 and D period of 3. The Slow Stochastic tries to predict the market direction further out than just one day.
Relative Strength Index: The RSI signal is unchanged and overbought.
- Settings: The relative strength index is set for a period of 5 which gives it 5 days of market movement to monitor. It is often the first indicator to show an overbought or oversold signal.
Rate of Change: The rate of change signal is rising and positive.
- Settings: Rate Of Change is set for a 21 period. This indicator looks back 21 days and compares price action from the past to the present. With the Rate Of Change, prices are rising when signals are positive. Conversely, prices are falling when signals are negative. As an advance rises the Rate Of Change signal should also rise higher, otherwise the rally is suspect. A decline should see the Rate Of Change fall into negative signals. The more negative the signals the stronger the decline.
Support and Resistance Levels To Be Aware Of:
4100 is resistance
4090 is resistance
4070 is resistance
4050 is resistance
4030 is resistance
4025 is resistance
4000 is resistance
3975 is resistance
3965 is resistance
3950 is resistance
3925 is light support
3900 is light support
3875 is light support
3850 is light support
3825 is light support
3800 is good support
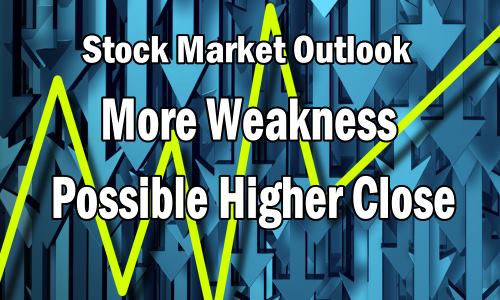
Stock Market Outlook for Tomorrow – Mon Nov 28 2022
For Monday the S&P chart is bullish but the technical indicators have weakened.
With protests in China in the news and Asian markets lower, weakness here at home is expected to start the day and through much of the morning.
However the technical indicators are now showing much strength to any downside move on Monday which means there is a good chance the index can end the day slightly higher.
Potential Economic and Political Market Moving Events
There are no economic events on Monday but later in the week there are many reports that will move stocks. On Wednesday we get a number of economic reports and the Fed’s Beige Book. On Thursday inflation reports will impact the markets and on Friday we get the November non-farm payroll numbers.
Stock Market Outlook Archives
Stock Market Outlook For Wed May 6 2026 – Choppy But Higher Still

Morning Investing Strategy Notes for Tue May 5 2026

Stock Market Outlook For Tue May 5 2026 – Overbought and Lower

Morning Investing Strategy Notes for Mon May 4 2026
Stock Market Outlook For Mon May 4 2026 – Dips Likely With Possible Lower Close

Morning Investing Strategy Notes for Fri May 1 2026
Stock Market Outlook For Fri May 1 2026 – Overbought But Higher

Morning Investing Strategy Notes for Thu Apr 30 2026
Stock Market Outlook For Thu Apr 30 2026 – Dips Likely Possible Lower Close
Morning Investing Strategy Notes for Wed Apr 29 2026
Stock Market Outlook For Wed Apr 29 2026 – Choppy But Higher Ahead Of More Earnings

Morning Investing Strategy Notes for Tue Apr 28 2026