

Friday was primarily a sideways day with the SPX almost making a new intraday high and then slipping to close down 6 points to end the day negative but for the week the SPX was up 15 points.
The NASDAQ made a new intraday high of 16121 and a new closing high at 16057. Both indexes saw good volumes but the percentages of stocks declining out distanced rising stocks by a fair margin throughout most of the week. That points to further weakness for the shortened Thanksgiving week. Let’s review the close on Friday Nov 19 to see what to expect to start the fourth week of November.
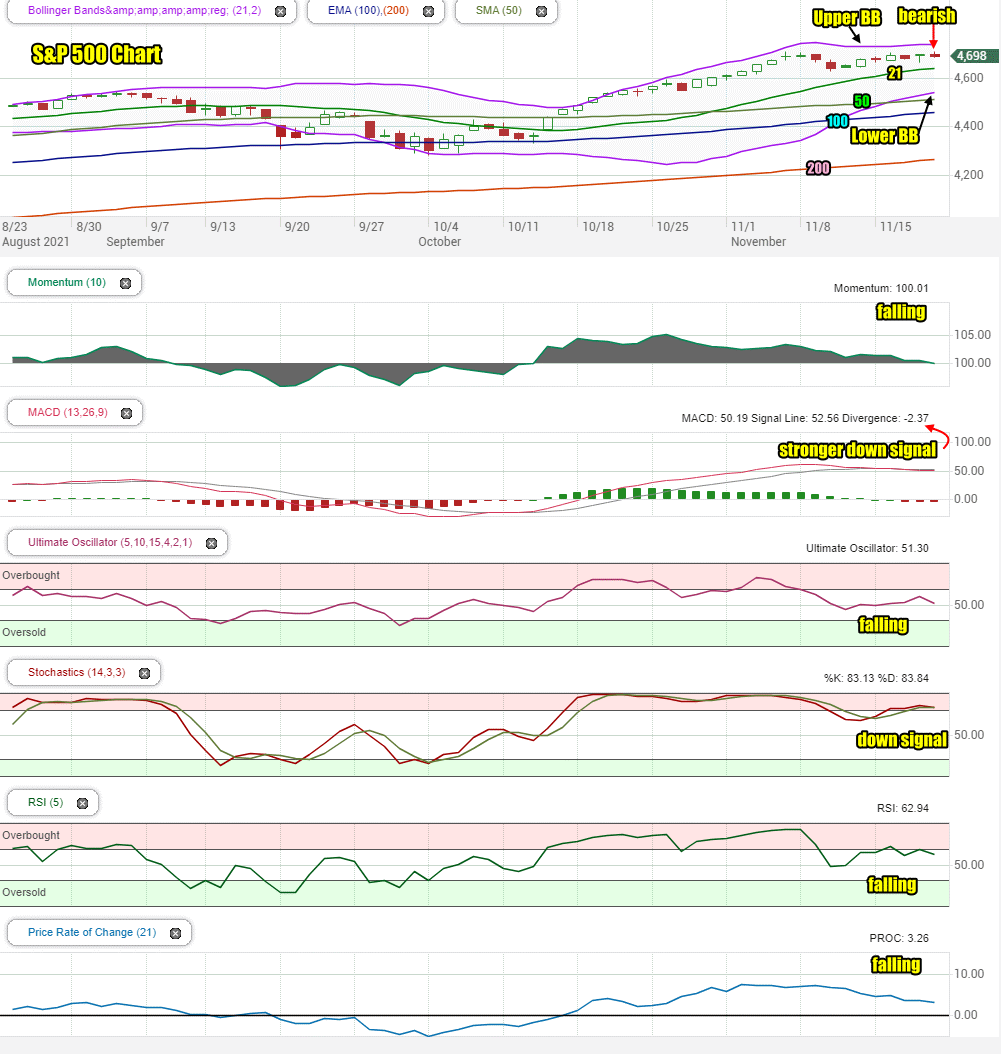
Stock Market Outlook Chart Comments At The Close on Fri Nov 19 2021
The close on Friday left behind a bearish candlestick for Monday. At the same time this candlestick also often precedes a bounce or a positive day.
The Lower Bollinger Band is still rising above the 50 day which is bearish. The Upper Bollinger Band is trending sideways which is bearish. The chance of a Bollinger Bands Squeeze is high for the fourth week of November,
The 21, 100 and 200 day moving averages are all climbing. This is bullish. The 50 day is back climbing as well, also bullish.
For Monday the chart is split almost equally between bearish and bullish signals.
Stock Market Outlook review of Fri Nov 19 2021
Stock Market Outlook: Technical Indicators Review:
Momentum: Momentum is falling and just managing to stay positive.
- Settings: For momentum I use a 10 period when studying market direction.
MACD Histogram: MACD (Moving Averages Convergence / Divergence) issued a down signal on Wed Nov 17 2021 . On Friday the down signal gained more strength.
- Settings: For MACD Histogram, I am using the Fast Points set at 13, Slow Points at 26 and Smoothing at 9.
Ultimate Oscillator: The Ultimate Oscillator is falling.
- Settings: The Ultimate Oscillator settings are: Period 1 is 5, Period 2 is 10, Period 3 is 15, Factor 1 is 4, Factor 2 is 2 and Factor 3 is 1. These are not the default settings but are the settings I use with the S&P 500 chart set for 1 to 3 months.
Slow Stochastic: The Slow Stochastic has a down to neutral signal for Monday.
Settings: For the Slow Stochastic I use the K period of 14 and D period of 3. The Slow Stochastic tries to predict the market direction further out than just one day.
Relative Strength Index: The RSI signal is falling but the trend has been sideways for several days.
- Settings: The relative strength index is set for a period of 5 which gives it 5 days of market movement to monitor. It is often the first indicator to show an overbought or oversold signal.
Rate of Change: The rate of change signal is falling to start the week.
- Settings: Rate Of Change is set for a 21 period. This indicator looks back 21 days and compares price action from the past to the present. With the Rate Of Change, prices are rising when signals are positive. Conversely, prices are falling when signals are negative. As an advance rises the Rate Of Change signal should also rise higher, otherwise the rally is suspect. A decline should see the Rate Of Change fall into negative signals. The more negative the signals the stronger the decline.
Support and Resistance Levels To Be Aware Of:
4700 is resistance
4655 is resistance
4600 is good support
4550 is light support
4525 is light support
4500 is support
4490 is support
4475 is support
4450 is support
4400 is support
4370 is light support
4350 is light support
4300 is light support
Stock Market Outlook for Tomorrow – Mon Nov 22 2021
For Monday the technical signals are more bearish. The trading action on Friday did not improve any signal. Most of the signals became more bearish.
The level of support though can now add in the 4600 valuation as good support. The SPX has been above 4600 for 15 trading days. It moved above 4600 on November 1 and has not broken below it. That has built support at 4600.
MACD on Friday ended the day with a stronger down signal which is a concern and means dips are going to be deeper to start the week. If that happens though, it is an opportunity to setup more trades as I expect a higher week by Friday (see below).
I will be setting up a new Market Direction Portfolio trade on Monday especially in any dips. The outline is in the morning Investing Strategy Notes for Monday, which is for members.
For Monday, despite so many bearish signals, I am expecting a positive close and potentially a new intraday 52 week high but watch for dips.
Historically the week of Thanksgiving has seen two very strong days. The trading day before Thanksgiving has a positive rating 80% of the time since I began trading in the great bear market of the mid-1970’s. The day after Thanksgiving has an even better track record with normally a 90% chance of a strong and higher close.
Normally for Thanksgiving week, I setup a lot of trades on Monday and Tuesday that end on Friday.
There will be a Black Friday membership special starting mid-week and running until Monday next week. I will be posting details shortly.
Stock Market Outlook Archives
Stock Market Outlook For Wed May 6 2026 – Choppy But Higher Still

Morning Investing Strategy Notes for Tue May 5 2026

Stock Market Outlook For Tue May 5 2026 – Overbought and Lower

Morning Investing Strategy Notes for Mon May 4 2026
Stock Market Outlook For Mon May 4 2026 – Dips Likely With Possible Lower Close

Morning Investing Strategy Notes for Fri May 1 2026
Stock Market Outlook For Fri May 1 2026 – Overbought But Higher

Morning Investing Strategy Notes for Thu Apr 30 2026
Stock Market Outlook For Thu Apr 30 2026 – Dips Likely Possible Lower Close
Morning Investing Strategy Notes for Wed Apr 29 2026
Stock Market Outlook For Wed Apr 29 2026 – Choppy But Higher Ahead Of More Earnings

Morning Investing Strategy Notes for Tue Apr 28 2026