
 Prior Trading Day Summary:
On Fri Nov 17 investors kept the S&P above 4500 for the entire day. While the gains made seemed small at the close with the SPX up just 5.78 points to 4514, the decline in sellers may signal another move higher for the shortened week of Thanksgiving.
Volume was low on Friday with just 3.8 billion shares traded on the S&P. 74% of all volume as traded to the upside.
On the NASDAQ the index was higher by 11 points on 4.5 billion shares traded with 74% of that volume to the upside.
With a shortened week ahead and the latest FOMC minutes released on Tuesday, normally this is a week of small advances for the indexes leading to Thanksgiving and then Black Friday shopping.
Let’s review the closing technical indicators from Fri Nov 17 2023 to see what to expect for Mon Nov 20 2023.
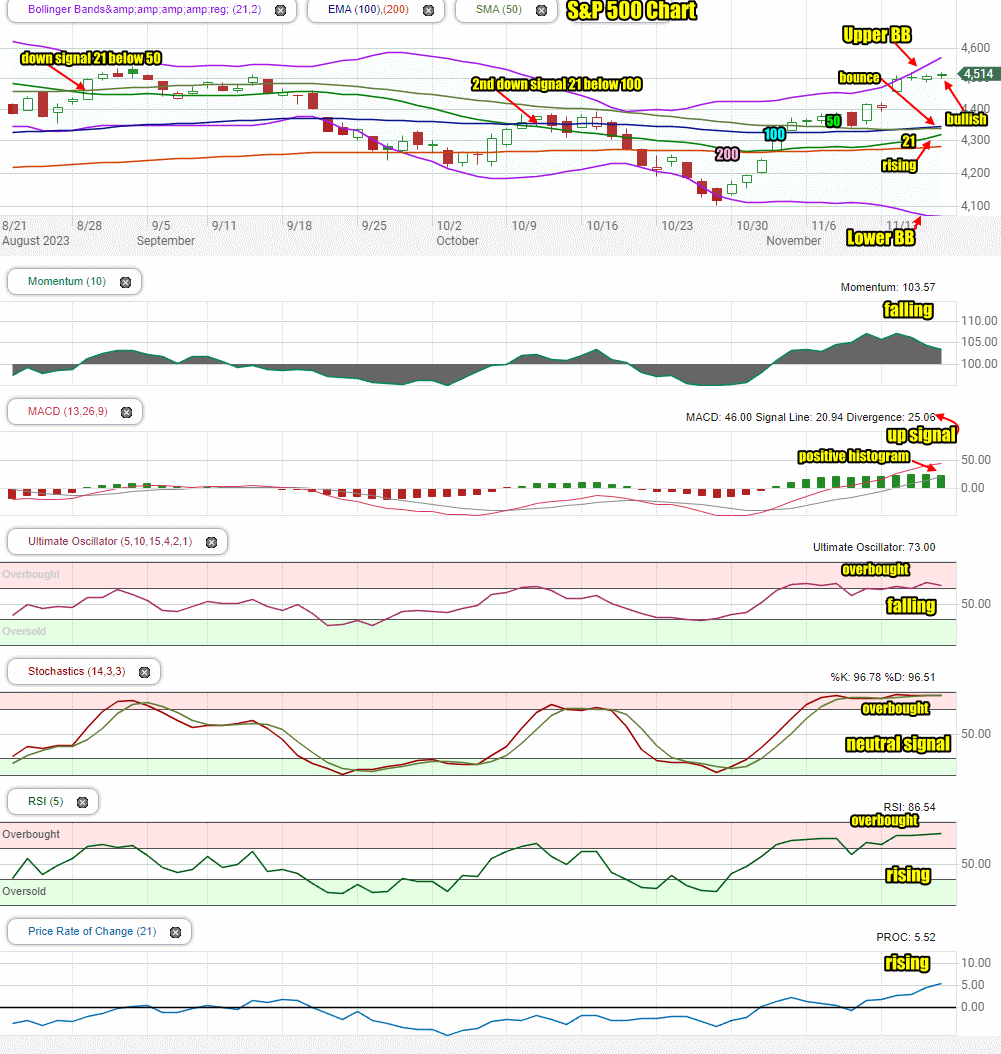
Stock Market Outlook: SPX Closing Chart For Fri Nov 17 2023
The index closed above all major moving averages and continued to move away from the Upper Bollinger Band. The outlook is still bullish.
The closing candlestick ended the day above 4500 which is bullish and continues to signal an overbought market.
The 21 day moving average continued to climb away from the 200 day which is bullish and is heading to the 100 day. A move above it would be a major up signal.
The 50 day moving average is moving away, above the 100 day as it continues to try to bounce.
The 200 day moving average is climbing which is bullish.
The Lower Bollinger Band is moving lower which is bullish. The Upper Bollinger Band is turning higher which is also bullish.
The S&P chart is more bullish than bearish heading into Monday but is still overbought..
Stock Market Outlook review of Fri Nov 17 2023
Stock Market Outlook: Technical Indicators Review
Momentum: Momentum is falling and positive.
|
MACD Histogram: MACD (Moving Averages Convergence / Divergence) issued an up signal on Thu Nov 2. On Fri Nov 17 2023 the close saw a slight dip in the strength of the up signal.
|
Ultimate Oscillator: The Ultimate Oscillator is falling and positive. It is signaling overbought.
|
Slow Stochastic: The Slow Stochastic has a neutral signal in place and is very overbought.
|
Relative Strength Index: The RSI signal is rising and positive. It is signaling overbought.
|
Rate of Change: The rate of change signal is rising and positive. It is signaling Monday we should see further advances.
|
Stock Market Outlook: Support and Resistance Levels |
| 4550 is resistance |
| 4535 is resistance |
| 4520 is resistance |
| 4500 is resistance |
| 4490 is resistance |
| 4475 is resistance |
| 4450 is support |
| 4440 is support |
| 4425 is support |
| 4400 is support |
| 4375 is support |
| 4350 is support |
| 4325 is support |
| 4300 is support |
| 4275 is light support |
| 4250 is light support |
| 4235 is light support |
| 4225 is support |
| 4200 is good support |
| 4185 is support |
| 4175 is support |
| 4150 is good support |
Stock Market Outlook for Mon Nov 20 2023
The technical indicators are still bullish and continue to signal overbought. Dips are likely but not expected to be deep on Monday.
For Monday the outlook is still higher for stocks by the close but dips are likely intraday.
Potential Economic and Political Market Moving Events
Tuesday is the latest FOMC minutes at 2:00 PM. This should be the major economic event for the week.
Monday:
10:00 Leading economic indicators are expected to be unchanged at -0.7%