
 Prior Trading Day Summary:
On Friday the May non-farm payroll numbers came in stronger than expected but the unemployment rate still rose to 4%. The day’s trading became mixed as investors tried to decide whether the report was negative or positive for stocks. The numbers seemed to suggest the Fed would hold off any interest rate cut following this strong payroll number.
The S&P closed down just 6 points to close at 5347. The NASDAQ closed down 40 points at 17,133.
For the upcoming week, investors get the latest Fed decision on interest rates, consumer price numbers, producer price reports and consumer sentiment. This will be a busy week which could potentially see volatility.
Let review the closing technical signals from Fri Jun 7 2024 to see what to expect for Mon Jun 10 2024.
Stock Market Outlook: SPX Closing Chart For Fri Jun 7 2024
The index closed above the 21 day moving average, touching the Upper Bollinger Band. This is bullish.
The closing candlestick is neutral but the long shadow indicates a good chance there will be some selling on Monday.
The 21 day moving average is still climbing continuing the latest up signal.
The 50 day moving average is climbing which is bullish.
The 200 day moving average is still climbing. The 200 day is at 4871 which is bullish and the 100 day is also climbing to 5085.
The Lower Bollinger Band is now above the 50 day moving average. The Upper Bollinger Band is turned higher as the SPX is in a Bollinger Bands Squeeze.
The S&P chart is bullish and the Bollinger Bands Squeeze now looks like stocks will move higher out of the squeeze.
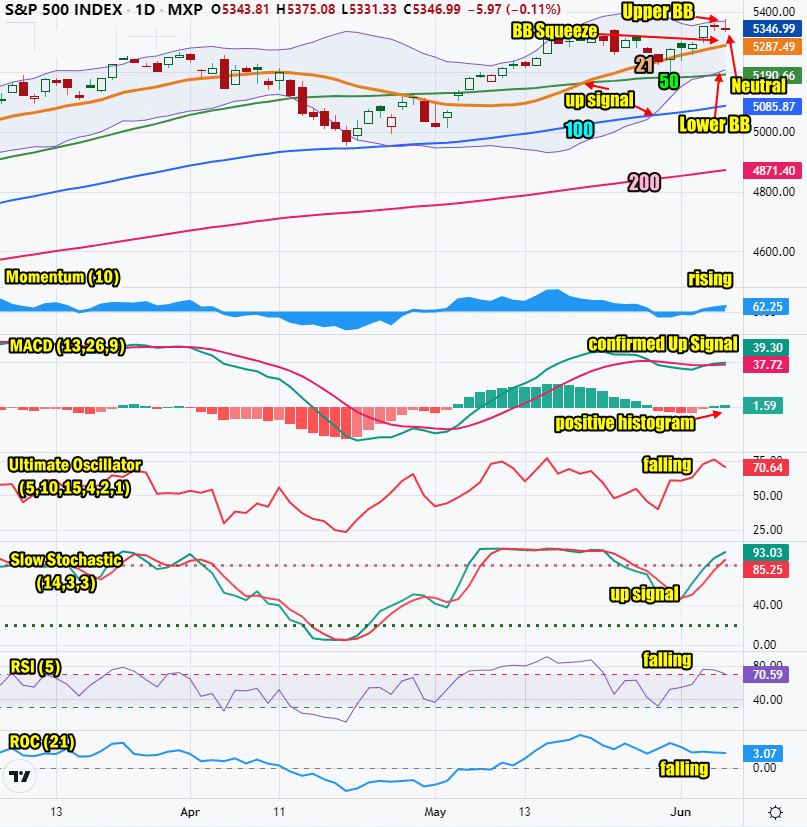
SPX Stock Market Outlook review of Fri Jun 7 2024 – chart courtesy TradingView
Stock Market Outlook: Technical Indicators Review
Momentum: Momentum is rising and positive.
|
MACD Histogram: MACD (Moving Averages Convergence / Divergence) issued an up signal on Thu Jun 6 2024. On Fri Jun 7 2024 the up signal was confirmed. The MACD histogram gained strength.
|
Ultimate Oscillator: The Ultimate Oscillator is falling and positive.
|
Slow Stochastic: The Slow Stochastic has an up signal in place and is overbought.
|
Relative Strength Index: The RSI signal is falling and positive.
|
Rate of Change: The rate of change signal is falling signaling that Monday will see some selling.
|
Stock Market Outlook: Support and Resistance Levels |
| 5400 is resistance |
| 5375 is resistance |
| 5350 is resistance |
| 5325 is resistance |
| 5310 is resistance |
| 5300 is resistance |
| 5275 is resistance |
| 5250 is light support |
| 5225 is light support |
| 5200 is good support |
| 5190 is light support |
| 5175 is light support |
| 5150 is support |
| 5125 is support |
| 5115 is support |
| 5100 is support |
Stock Market Outlook for Mon Jun 10 2024
For Monday the technical indicators and the SPX closing candlestick on Friday are signaling there will be some selling and dips. The dips could get deeper than expected.
The close is expected to be negative with lower volumes as investors will be waiting for Wednesday’s FOMC latest interest rate decision. Monday should close slightly lower.
Potential Economic and Political Market Moving Events
This is a big week for economic numbers.
Monday:
No reports