
The stock market outlook for Friday was for weakness but a dip no deeper than 2795 and probably not below 2800. From there I had expected a slightly higher close on Friday. Instead, the morning did see weakness but no drop to 2795. However by the close, the market was down just slightly as investors seemed to sit on the sidelines on Friday waiting for more signals to determine what to be buying next.
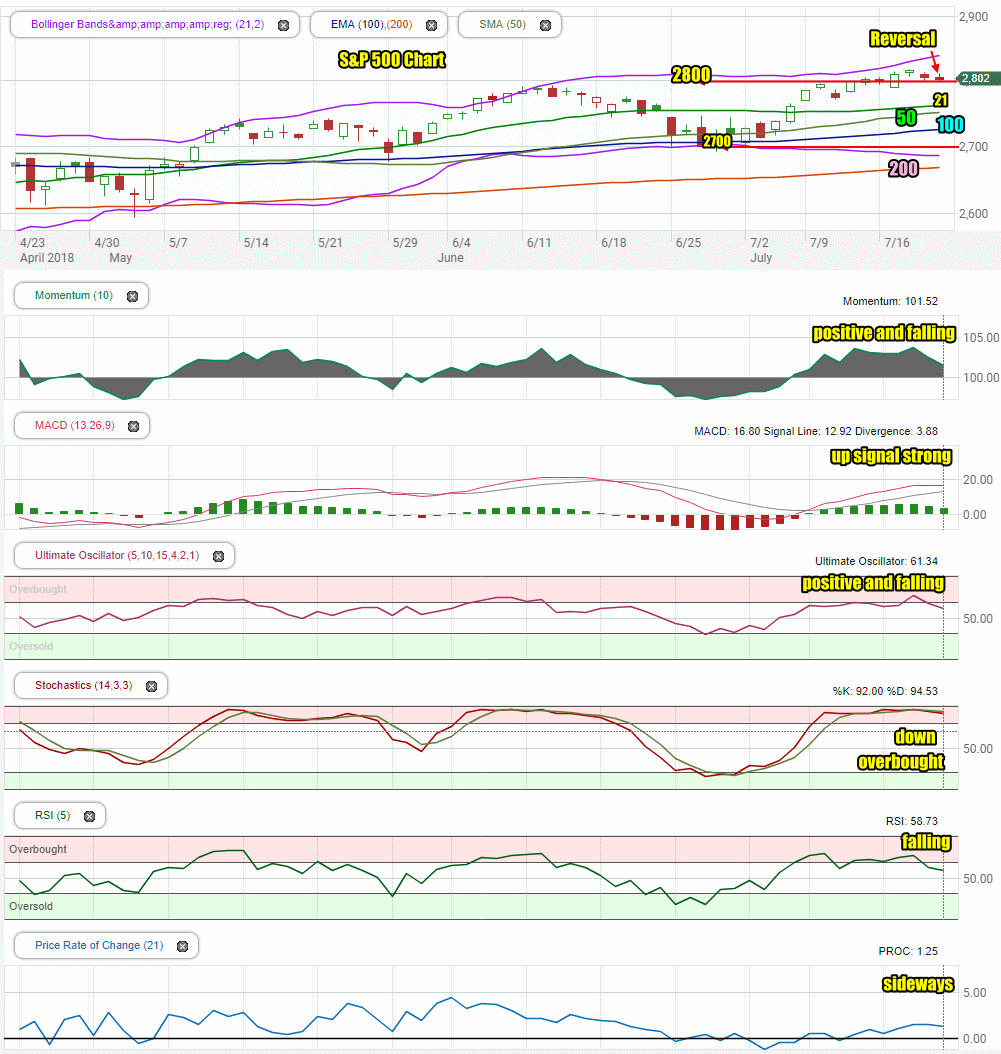
Stock Market Outlook Chart Comments At The Close on Fri Jul 20 2018
The S&P ended the day on Friday still above 2800. This marked the fifth day above 2800 of the last six trading days. However the index is not actually climbing but instead continues to trend sideways, staying above 2800.
The closing candlestick on Friday is signaling a possible reversal to start off the week. That would mean a higher close on Monday.
All the major moving averages are rising.
The Bollinger Bands are continuing to signal the index will move higher.
The SPX chart is still bullish.
Stock Market Outlook review of Jul 20 2018
Stock Market Outlook: Technical Indicators Review:
Momentum: For momentum I use a 10 period when studying market direction. Momentum is positive and falling.
MACD Histogram: For MACD Histogram, I am using the Fast Points set at 13, Slow Points at 26 and Smoothing at 9. MACD (Moving Averages Convergence / Divergence) issued an up signal on July 9. The up signal was still strong on Friday.
Ultimate Oscillator: The Ultimate Oscillator settings are: Period 1 is 5, Period 2 is 10, Period 3 is 15, Factor 1 is 4, Factor 2 is 2 and Factor 3 is 1. These are not the default settings but are the settings I use with the S&P 500 chart set for 1 to 3 months. The Ultimate Oscillator signal is positive and falling.
Slow Stochastic: For the Slow Stochastic I use the K period of 14 and D period of 3. The Slow Stochastic tries to predict the market direction further out than just one day. The Slow Stochastic is extremely overbought and has a down signal in place for Monday.
Relative Strength Index: The relative strength index is set for a period of 5 which gives it 5 days of market movement to monitor. It is often the first indicator to show an overbought or oversold signal. The RSI signal is falling and is no longer overbought.
Rate of Change: Rate Of Change is set for a 21 period. This indicator looks back 21 days and compares price action from the past to the present. With the Rate Of Change, prices are rising when signals are positive. Conversely, prices are falling when signals are negative. As an advance rises the Rate Of Change signal should also rise higher, otherwise the rally is suspect. A decline should see the Rate Of Change fall into negative signals. The more negative the signals the stronger the decline. The rate of change signal is positive but moving sideways.
Support Levels To Be Aware Of:
2745 to 2750 is light support
2725 is light support.
2700 is support.
2675 is light support.
2650 is light support
2620 is light support
2600 is strong support.
There is good support at the 2550 level from where the market bounced back from the recent correction low on Feb 9.
The S&P has light support at 2480. It also has light support at 2450 and good support at 2425. Below that there is some support at 2400, 2380, 2350. 2300 has the most support at present but would represent a full correction as a drop to this level would be 20% and just 5% away from a potential bear market signal.
Stock Market Outlook for Tomorrow – Mon Jul 23 2018
For Monday, we should see the index move higher at the open, dip part way through the morning and then move higher into the close.
The technical indicators are still showing signs of weakness including the sell signal from the Slow Stochastic. However all the signals are still strongly bullish aside from the Slow Stochastic.
The closing candlestick on Friday is often followed by a recovery. That could be the case for Monday as well.
Overall the index remains bullish. Monday should close higher.
Stock Market Outlook Archives
Stock Market Outlook For Wed May 6 2026 – Choppy But Higher Still

Morning Investing Strategy Notes for Tue May 5 2026

Stock Market Outlook For Tue May 5 2026 – Overbought and Lower

Morning Investing Strategy Notes for Mon May 4 2026
Stock Market Outlook For Mon May 4 2026 – Dips Likely With Possible Lower Close

Morning Investing Strategy Notes for Fri May 1 2026
Stock Market Outlook For Fri May 1 2026 – Overbought But Higher

Morning Investing Strategy Notes for Thu Apr 30 2026
Stock Market Outlook For Thu Apr 30 2026 – Dips Likely Possible Lower Close
Morning Investing Strategy Notes for Wed Apr 29 2026
Stock Market Outlook For Wed Apr 29 2026 – Choppy But Higher Ahead Of More Earnings

Morning Investing Strategy Notes for Tue Apr 28 2026