

Prior Trading Day Summary:
On Friday the initial investor reaction to the PCE numbers was buying but when the SPX jumped to over 5523 making a new high, sellers emerged and the index moved lower. By the end of the day the SPX was down 22 points to close at 5460, The NASDAQ fell 126 points to close at 17,732.
For the start of July, stocks have a shortened week thanks to the July 4th holiday. Normally trading volume will be lower the day before and after the holiday.
On Friday there were changes in a number of technical indicators.
Let’s review the technical indicators from the close on Fri Jun 28 2024 to see what to expect on Mon Jul 1 2024.
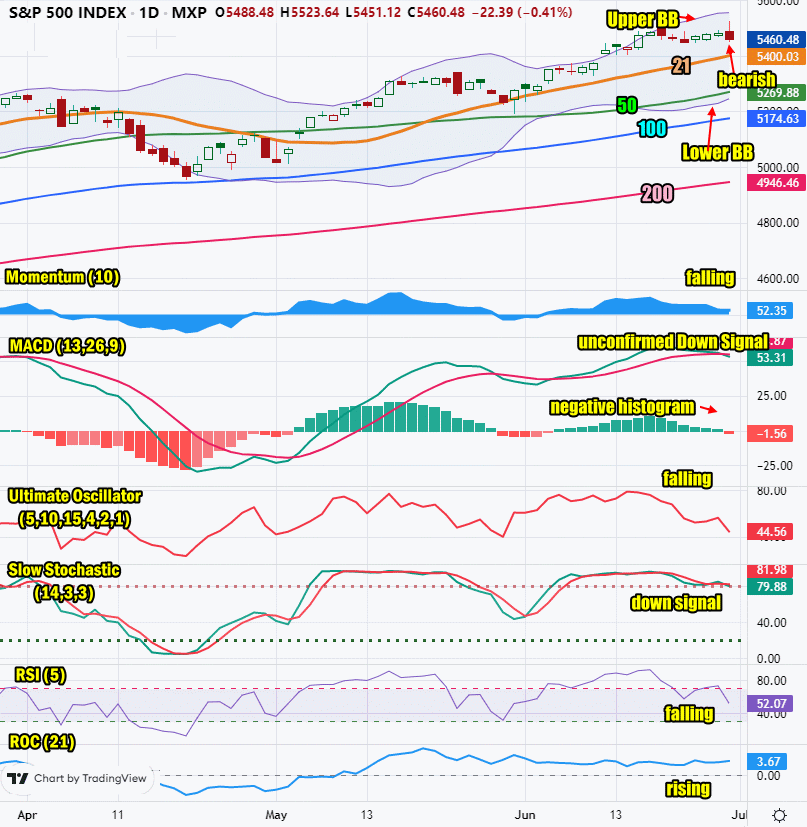
Stock Market Outlook: SPX Closing Chart For Fri Jun 28 2024
The index closed above the 21 day moving average but pulled back from the opening high and closed at the low of the day.
The closing candlestick is bearish for Monday but also signals that a bounce is likely.
The 21 day moving average is still climbing continuing the latest up signal.
The 50 day moving average is climbing which is bullish.
The 200 day moving average is still climbing. The 200 day is at 4946 which is bullish and the 100 day is also climbing to 5174.
The Lower Bollinger Band is below the 50 day moving average and turning up. The Upper Bollinger Band is turning sideways. At present the signal is bullish.
The S&P chart is bearish for Monday but a bounce is probable.
SPX Stock Market Outlook review of Fri Jun 28 2024
Stock Market Outlook: Technical Indicators Review
Momentum: Momentum is falling and positive.
|
MACD Histogram: MACD (Moving Averages Convergence / Divergence) issued an up signal on Thu Jun 6 2024. On Fri Jun 28 2024 an unconfirmed down signal was issued. The MACD histogram also lost strength and turned negative.
|
Ultimate Oscillator: The Ultimate Oscillator is falling and negative.
|
Slow Stochastic: The Slow Stochastic has a down signal in place.
|
Relative Strength Index: The RSI signal is falling and positive.
|
Rate of Change: The rate of change signal is rising signaling that Monday could end higher.
|
Stock Market Outlook: Support and Resistance Levels |
| 5500 is resistance |
| 5490 is resistance |
| 5475 is resistance |
| 5465 is resistance |
| 5450 is resistance |
| 5425 is resistance |
| 5400 is resistance |
| 5375 is resistance |
| 5350 is support |
| 5325 is support |
| 5310 is support |
| 5300 is support |
| 5275 is support |
| 5250 is light support |
| 5225 is light support |
| 5200 is good support |
| 5190 is light support |
Stock Market Outlook for Mon Jul 1 2024
For Monday, the SPX is facing an unconfirmed down signal from the MACD indicator. This has been a fairly accurate indicator for the past several years. Most of the other indicators have also turned lower. With this many down signals, a bounce is likely Monday or if that fails, Tuesday.
Potential Economic and Political Market Moving Events
The biggest economic event this week if the June Non-Farm Payroll numbers due out on Friday.
Monday:
9:45 S&P US Manufacturing PMI is expected at 51.7%
10:00 Construction spending is estimated to rise to 0.2% from -0.1%
10:00 ISM Manufacturing is expected to rise to 49.2% from 48.7%