

Friday was another day of low volume trading to end the day with a small loss of 12 points. Once again, most of the loss was at the end of the day. The Index closed the year at 4766.18. It was the best December since 2010 with the S&P up 4.3% in December. For the year the S&P was up 26.89% marking a third straight year of gains. The NASDAQ ended Friday down 96 points for a flat December but for the year the index was up 21.39% also a third year of straight gains.
With 2021 finished, historically the first two trading days of the new year are positive. Let’s review Friday’s close on the S&P to see what investors should expect for Monday.
Stock Market Outlook Chart Comments At The Close on Fri Dec 31 2021
The closing candlestick on Friday is bearish but often is followed by a bounce. The Upper Bollinger Band is still rising which is bullish. The Lower Bollinger Band has turned back up which at present is neutral.
Meanwhile the 21 day moving average is climbing above the 50 day which is bullish.
The 50, 100 and 200 day moving averages are still climbing, all of which is bullish.
For Mon Jan 3 2022 the chart is bullish.
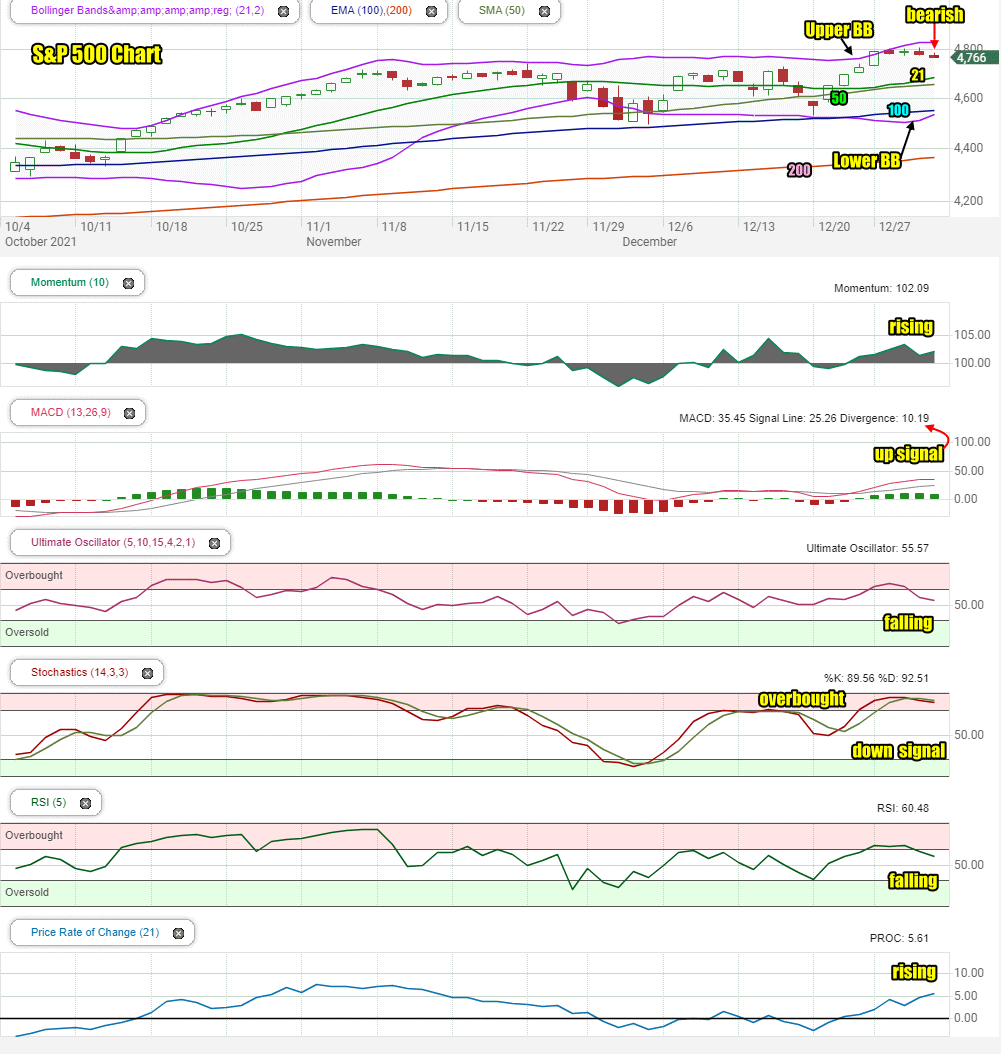
Stock Market Outlook review of Fri Dec 31 2021
Stock Market Outlook: Technical Indicators Review:
Momentum: Momentum is rising and positive.
- Settings: For momentum I use a 10 period when studying market direction.
MACD Histogram: MACD (Moving Averages Convergence / Divergence) issued an up signal on Thursday Dec 23. On Friday the up signal was still strong.
- Settings: For MACD Histogram, I am using the Fast Points set at 13, Slow Points at 26 and Smoothing at 9.
Ultimate Oscillator: The Ultimate Oscillator is falling for a second day.
- Settings: The Ultimate Oscillator settings are: Period 1 is 5, Period 2 is 10, Period 3 is 15, Factor 1 is 4, Factor 2 is 2 and Factor 3 is 1. These are not the default settings but are the settings I use with the S&P 500 chart set for 1 to 3 months.
Slow Stochastic: The Slow Stochastic has a down signal in place and is extremely overbought.
Settings: For the Slow Stochastic I use the K period of 14 and D period of 3. The Slow Stochastic tries to predict the market direction further out than just one day.
Relative Strength Index: The RSI signal is falling.
- Settings: The relative strength index is set for a period of 5 which gives it 5 days of market movement to monitor. It is often the first indicator to show an overbought or oversold signal.
Rate of Change: The rate of change signal is rising.
- Settings: Rate Of Change is set for a 21 period. This indicator looks back 21 days and compares price action from the past to the present. With the Rate Of Change, prices are rising when signals are positive. Conversely, prices are falling when signals are negative. As an advance rises the Rate Of Change signal should also rise higher, otherwise the rally is suspect. A decline should see the Rate Of Change fall into negative signals. The more negative the signals the stronger the decline.
Support and Resistance Levels To Be Aware Of:
4800 is resistance
4725 is resistance
4700 is resistance
4670 is support
4655 is light support.
4600 is good support
4550 is light support
4525 is light support
4500 is support
Stock Market Outlook for Tomorrow – Mon Jan 3 2022
Historically the first two trading days of the new year are positive. The technical indicators are showing the index as still overbought but ready for a potential bounce. The closing candlestick also points to a probable bounce to start the new year.
Stock Market Outlook Archives
Stock Market Outlook For Wed May 6 2026 – Choppy But Higher Still

Morning Investing Strategy Notes for Tue May 5 2026

Stock Market Outlook For Tue May 5 2026 – Overbought and Lower

Morning Investing Strategy Notes for Mon May 4 2026
Stock Market Outlook For Mon May 4 2026 – Dips Likely With Possible Lower Close

Morning Investing Strategy Notes for Fri May 1 2026
Stock Market Outlook For Fri May 1 2026 – Overbought But Higher

Morning Investing Strategy Notes for Thu Apr 30 2026
Stock Market Outlook For Thu Apr 30 2026 – Dips Likely Possible Lower Close
Morning Investing Strategy Notes for Wed Apr 29 2026
Stock Market Outlook For Wed Apr 29 2026 – Choppy But Higher Ahead Of More Earnings

Morning Investing Strategy Notes for Tue Apr 28 2026