
The Unemployment news on Friday sent stocks lower as while the unemployment rate fell, much of the drop was caused by a growing number of people not looking for work. The jobs numbers for December were half of what was estimated. This seemed to be in sharp contrast to the weekly initial claims which kept pointing at an expectation for a huge number of employed for December. Whatever the reasons, the end result was an early jump and then more selling which by 11:00 AM had the index at the day’s low. Every rally attempt was stalled by sellers. The final hour saw the typical selling we saw all week. The S&P closed down a modest 19 points for less than half a percent loss to end the day at 4677 just 23 points below the 4700 valuation.
The NASDAQ closed down a percent for a 145 points loss and a close below 15,000 at 14,935.
The week was among the worst starts to a January. Historically the first 5 trading days of January are a warning signal if the index closes lower. That means 2022 could be poor for equities.
Stock Market Outlook Chart Comments At The Close on Fri Jan 7 2022
There are further changes to the technical signals following Friday’s close.
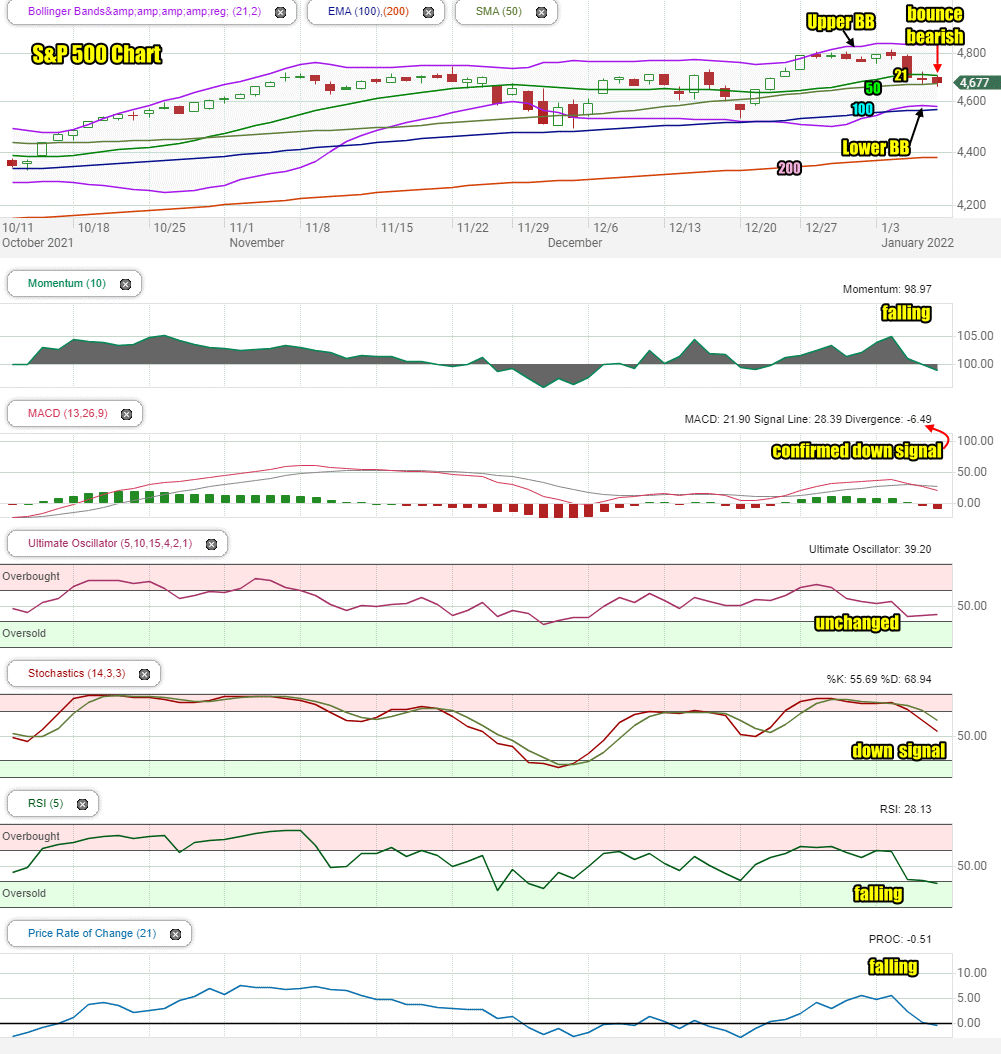
The index on Friday fell below the 50 day moving average before closing back at the 50 day. Normally we should expect a bounce attempt off the 50 day. Indeed the closing candlestick on Friday points to the strong probability of a bounce attempt but it is also bearish following a bounce.
The Upper Bollinger Band is turning lower which is bearish. The Lower Bollinger Band has turned back up and moved above the 100 day moving average. This is now bearish. There are signs though that it may fall back below the 100 day this week. That could be bullish.
Meanwhile the 21 day moving average is turning lower which is bearish.
The 50 day is churning sideways.
Only the 100 and 200 day moving averages are still climbing which is bullish.
For the start of the second week of January, the chart is decidedly bearish.
Stock Market Outlook review of Fri Jan 7 2022
Stock Market Outlook: Technical Indicators Review:
Momentum: Momentum is falling sharply and is negative.
- Settings: For momentum I use a 10 period when studying market direction.
MACD Histogram: MACD (Moving Averages Convergence / Divergence) issued an down signal on Thursday Jan 6. On Friday the down signal was confirmed by a stronger down signal.
- Settings: For MACD Histogram, I am using the Fast Points set at 13, Slow Points at 26 and Smoothing at 9.
Ultimate Oscillator: The Ultimate Oscillator is unchanged and near oversold.
- Settings: The Ultimate Oscillator settings are: Period 1 is 5, Period 2 is 10, Period 3 is 15, Factor 1 is 4, Factor 2 is 2 and Factor 3 is 1. These are not the default settings but are the settings I use with the S&P 500 chart set for 1 to 3 months.
Slow Stochastic: The Slow Stochastic has a down signal in place.
Settings: For the Slow Stochastic I use the K period of 14 and D period of 3. The Slow Stochastic tries to predict the market direction further out than just one day.
Relative Strength Index: The RSI signal is falling and starting to show oversold readings.
- Settings: The relative strength index is set for a period of 5 which gives it 5 days of market movement to monitor. It is often the first indicator to show an overbought or oversold signal.
Rate of Change: The rate of change signal is falling.
- Settings: Rate Of Change is set for a 21 period. This indicator looks back 21 days and compares price action from the past to the present. With the Rate Of Change, prices are rising when signals are positive. Conversely, prices are falling when signals are negative. As an advance rises the Rate Of Change signal should also rise higher, otherwise the rally is suspect. A decline should see the Rate Of Change fall into negative signals. The more negative the signals the stronger the decline.
Support and Resistance Levels To Be Aware Of:
4800 is resistance
4725 is resistance
4700 is support
4670 is support
4655 is light support.
4600 is good support
4550 is light support
4525 is light support
4500 is support
Stock Market Outlook for Tomorrow – Mon Jan 10 2022
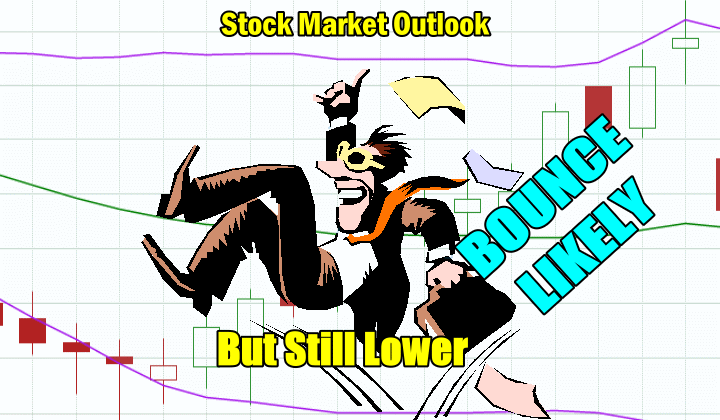
For Monday, investors should expect a bounce attempt. The signals are becoming strongly bearish and with the index itself closing at the 50 day moving average, normally a bounce can be expected.
The indicators though are also advising that following any bounce attempt there is a strong chance of the index moving still lower. A test of the 100 day could be in the cards this week, but that’s just a guess.
For now the outlook is for a bounce and then a drop either late in the day on Monday or on Tuesday.
Stock Market Outlook Archives
Stock Market Outlook For Wed May 6 2026 – Choppy But Higher Still

Morning Investing Strategy Notes for Tue May 5 2026

Stock Market Outlook For Tue May 5 2026 – Overbought and Lower

Morning Investing Strategy Notes for Mon May 4 2026
Stock Market Outlook For Mon May 4 2026 – Dips Likely With Possible Lower Close

Morning Investing Strategy Notes for Fri May 1 2026
Stock Market Outlook For Fri May 1 2026 – Overbought But Higher

Morning Investing Strategy Notes for Thu Apr 30 2026
Stock Market Outlook For Thu Apr 30 2026 – Dips Likely Possible Lower Close
Morning Investing Strategy Notes for Wed Apr 29 2026
Stock Market Outlook For Wed Apr 29 2026 – Choppy But Higher Ahead Of More Earnings

Morning Investing Strategy Notes for Tue Apr 28 2026