
 Prior Trading Day Summary:
On Friday stocks spiked at the open reaching 5107 before spending the rest of the day in choppy trading but closing almost flat, up 1 points at 5088.
The NASDAQ ended the day down 44 points to close at 15,996.
Trading volume slipped a bit on Friday but most of the action was basically stocks consolidating recent gains and waiting for the final week of February.
Let’s review Friday’s closing technical indicators to see what we should expect for the start of the final week of February 2024.
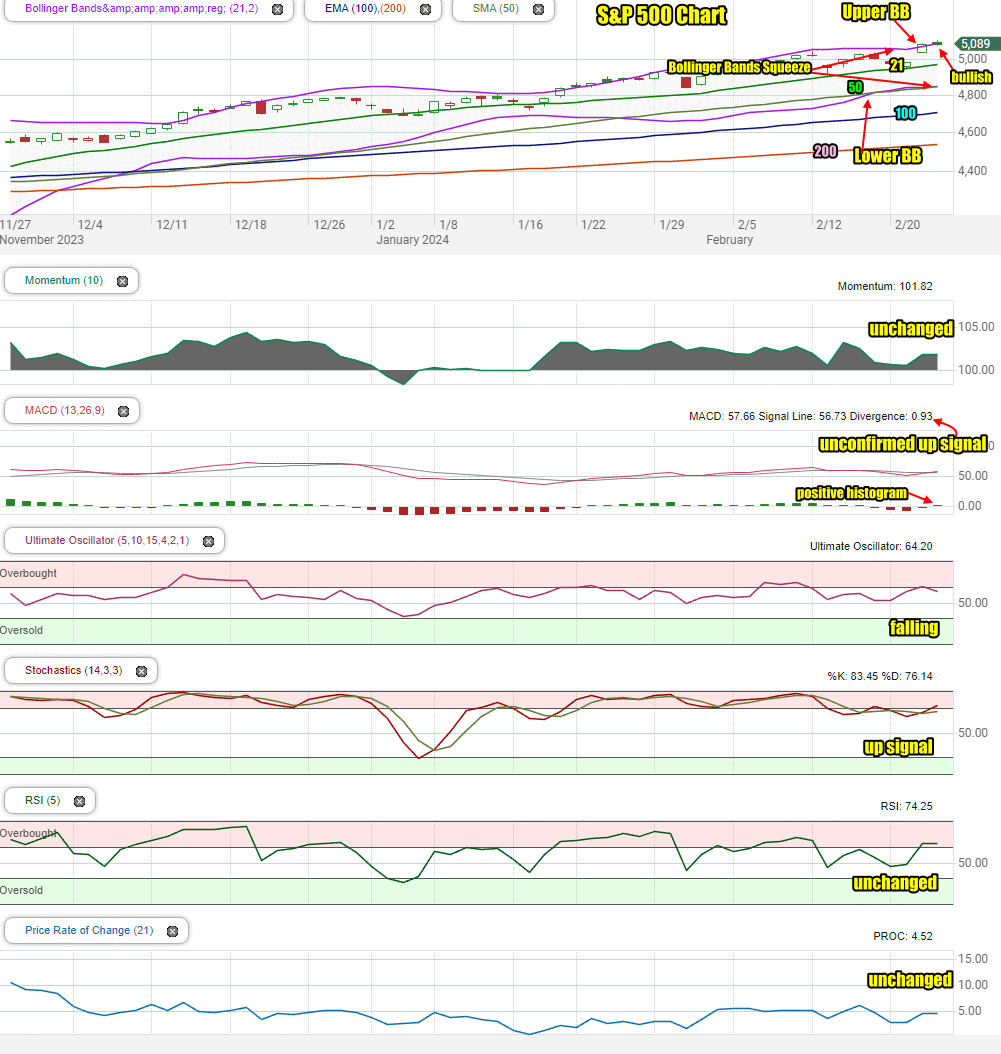
Stock Market Outlook: SPX Closing Chart For Fri Feb 23 2024
The index closed at the Upper Bollinger Band on Friday. This is bullish.
The closing candlestick is bullish for Monday but often this candlestick signals some weakness should be expected and dips may occur. A large up day is not being signaled.
The 21 day moving average is moving higher which is bullish. It is at 4975 on the SPX.
The 50 day moving average is rising and at 4850 which is bullish.
The 100 and 200 day moving averages are climbing which is bullish. The 200 day is at 4530 on the SPX which is bullish.
The Bollinger Bands are still in a Bollinger Bands Squeeze and appear to be signaling a move higher out of the squeeze.
The S&P chart is more bullish than bearish for the start of the final week of February.
Stock Market Outlook review of Fri Feb 23 2024
Stock Market Outlook: Technical Indicators Review
Momentum: Momentum is unchanged and positive.
|
MACD Histogram: MACD (Moving Averages Convergence / Divergence) issued a down signal on Fri Feb 16 2024. On Fri Feb 23 2024 a new unconfirmed up signal was generated.
|
Ultimate Oscillator: The Ultimate Oscillator is falling and positive.
|
Slow Stochastic: The Slow Stochastic has an up signal in place and is not overbought.
|
Relative Strength Index: The RSI signal is unchanged and positive. It is overbought.
|
Rate of Change: The rate of change signal is unchanged, signaling Monday won’t be a lot different from Friday.
|
Stock Market Outlook: Support and Resistance Levels |
| 5100 is resistance |
| 5090 is resistance |
| 5075 is resistance |
| 5050 is resistance |
| 5025 is resistance |
| 5010 is resistance |
| 5000 is resistance |
| 4990 is resistance |
| 4975 is resistance |
| 4950 is resistance |
| 4925 is resistance |
| 4915 is resistance |
| 4900 is support |
| 4875 is support |
| 4850 is support |
| 4825 is support |
| 4815 is support |
| 4800 is support |
| 4780 is support |
| 4750 is support |
Stock Market Outlook for Mon Feb 26 2024
For Monday the technical indicators are signaling more choppy action, primarily heading sideways but still keeping a slight up bias, is likely. Stocks are overbought and consolidating the gains made.
Potential Economic and Political Market Moving Events
This is a busy week for reports including durable goods order on Tuesday, retail and wholesale inventories on Wednesday, PCE on Thursday and manufacturing on Friday.
Monday:
10:00 New home sales are expected to dip -0.5%