FullyInformed.com
Generic filters
Exact matches only
Search in title
Search in content
Search in excerpt

Stock Market Outlook for Mon Dec 30 2024 – Looking For Santa Claus Rally

Dec 29, 2024 | Stock Market Outlook

Looking For Santa Claus Rally - Stock Market OutlookPrior Trading Day Summary:

Friday was a low volume day on the S&P but not on the NASDAQ where 8 billion shares were traded. Whether the day was primarily profit-taking or computerized trading as the market dipped lower, the close saw the S&P down 66 points to $5970 and the NASDAQ down 298 points to 19,722.

Despite the high volume on the NASDAQ 51% of all volume was to the upside but 71% of all stocks were falling. This indicates that volume being traded higher was more concentrated in specific stocks while the broader NASDAQ fell.

On The S&P 75% of all volume was traded lower and 80% of all stocks were falling.

Some of the drop on Friday had to do with computerized trading where specific price points were reached and stocks were sold out. As the market fell, volume increased but the retreat was fairly orderly, another hint that much of the trading was automated.

This week will give us a better idea whether the Santa Claus Rally will restart.

Let’s review the technical indicators at the close on Fri Dec 27 2024 to see what to expect for Mon Dec 30 2024


Stock Market Outlook: SPX Closing Chart For Fri Dec 27 2024

The index closed below the 21 day moving average after reaching the 50 day and bouncing off it intraday. Overall this is bearish.

The closing candlestick shows a long shadow . Often this shadows signals a bounce coming today. Overall though the candlestick is bearish.

The 21 day moving average fell back 70 6022 which is bearish.

The 50 day moving average is higher at 5940 which is bullish.

The 100 day moving average is rising and closed at 5800 which is bullish.

The 200 day moving average is in an uptrend and closed at 5550 which is bullish.

The Lower Bollinger Band is below the 50 day and moving lower which is bearish. The Upper Bollinger Band is trending sideways which is neutral.

The S&P chart is almost split between bullish and bearish signal although the lower 21 day is a signal to watch.

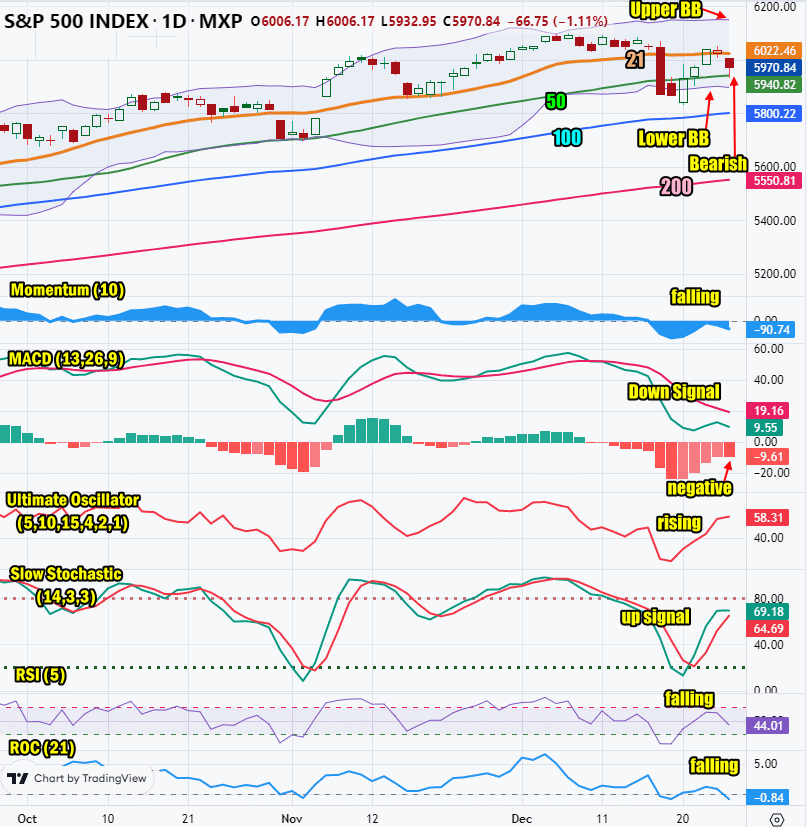
SPX Stock Market Outlook review of Fri Dec 27 2024


Stock Market Outlook: Technical Indicators Review

Momentum: Momentum is falling and negative.

  • Settings: For momentum I use a 10 period when studying market direction.
MACD Histogram: MACD (Moving Averages Convergence / Divergence) issued a down signal on Tuesday Dec 10 2024 . The down signal gained some strength on Friday but considering the large loss it is not as strongly negative as I would have expected.

  • Settings: For MACD Histogram, I am using the Fast Points set at 13, Slow Points at 26 and Smoothing at 9. 
Ultimate Oscillator: The Ultimate Oscillator was rising but turned sideways on Friday at the close.

  • Settings: The Ultimate Oscillator settings are: Period 1 is 5, Period 2 is 10, Period 3 is 15, Factor 1 is 4, Factor 2 is 2 and Factor 3 is 1. These are not the default settings but are the settings I use with the S&P 500 chart set for 1 to 3 months.
Slow Stochastic: The Slow Stochastic has an up signal in place that looks ready to turn into a down signal.

  • Settings: For the Slow Stochastic I use the K period of 14 and D period of 3. The Slow Stochastic tries to predict the market direction further out than just one day.
Relative Strength Index: The RSI signal is falling.

  • Settings: The relative strength index is set for a period of 5 which gives it 5 days of market movement to monitor.  It is often the first indicator to show an overbought or oversold signal.
Rate of Change: The rate of change signal is falling and signaling a lower day for Monday.

  • Settings: Rate Of Change is set for a 21 period. This indicator looks back 21 days and compares price action from the past to the present. With the Rate Of Change, prices are rising when signals are positive. Conversely, prices are falling when signals are negative. As an advance rises, the Rate Of Change signal should also rise higher, otherwise the rally is suspect. A decline should see the Rate Of Change fall into negative signals. The more negative the signals the stronger the decline.

Stock Market Outlook: Support and Resistance Levels

6100 is strong resistance
6090 is resistance
6070 is resistance
6050 is resistance
6025 is resistance
6015 is resistance
6000 is resistance
5990 is resistance
5970 is resistance
5950 is support
5900 is support
5890 is support
5875 is support
5850 is support
5825 is support
5800 is support
5790 is support
5775 is support
5765 is support
5750 is support
5725 is support
5700 is support


Stock Market Outlook for Mon Dec 30 2024 

If you look at the support / resistance chart above you can see that 5970 is a resistance level and 5950 is support. On Friday the market closed right at the 5970 level. Today I would expect the SPX to dip down to 5950 and then attempt a bounce.

The technical indicators are decidedly negative but there are still a few that are signaling almost a wait and see outlook for today. In particular the MACD indicator did not gain much strength to the downside but instead matched Thursday’s signal. It is giving investors a “wait and see” signal for Monday.

We have seen these types of events in Santa Claus Rallies before, especially when markets are sitting at all-time highs which they are presently. Monday could end up being lower again but we could still see Santa Claus come to the rescue, only from a lower valuation.


Potential Economic and Political Market Moving Events

Monday:

9:45 Chicago business barometer (PMI) is expected to rise to 42.2 from 40.2 prior

10:00 Pending home sales are expected to fall to 0.7% from 2.0% prior


Recent Outlooks

Stock Market Outlook For Thu May 7 2026 – Bullish and Still Higher

Prior Trading Day Summary On Wednesday stocks soared as strong earnings from Advanced Micro Devices Stock (AMD) sparked another rally. The SPX made another new intraday high as it reached 7369. The index closed up 106 points to end the …

Morning Investing Strategy Notes for Wed May 6 2026

For FullyInformed Members the morning Investing Strategy Notes for Wed May 6 2026 look at the rebound on Tuesday following Monday’s selling.. There are a large number of equities discussed in today’s morning Investing Strategy Notes. They include Palantir Tech …

Stock Market Outlook For Wed May 6 2026 – Choppy But Higher Still

Prior Trading Day Summary On Tuesday stocks again shook off Middle East worries and climbed higher. The SPX made another new intraday high as it reached 7273. The index closed up 58 points to end the day at 7259 on …

Morning Investing Strategy Notes for Tue May 5 2026

For FullyInformed Members the morning Investing Strategy Notes for Tue May 5 2026 look at the dip on Monday and the chance for another lower close today. There are a large number of equities discussed in today’s morning Investing Strategy …

Stock Market Outlook For Tue May 5 2026 – Overbought and Lower

Prior Trading Day Summary On Monday stocks saw some minor pressure and ended the day slightly lower. The SPX lost 29 points to close at 7200 on 5.2 billion shares traded. 63% of all stocks were falling by the close …

Morning Investing Strategy Notes for Mon May 4 2026

For FullyInformed Members the morning Investing Strategy Notes for Mon May 4 2026 look at the chance for a lower close. There are a large number of equities discussed in today’s morning Investing Strategy Notes. They include Palantir Tech Stock …

Stock Market Outlook For Mon May 4 2026 – Dips Likely With Possible Lower Close

Prior Trading Day Summary On Friday stocks continued to push higher on the back of better than estimated earnings from a number of large cap companies. With their stocks continuing to climb, stocks are once more extremely overbought. The SPX …

Morning Investing Strategy Notes for Fri May 1 2026

For FullyInformed Members the morning Investing Strategy Notes for Fri May 1 2026 look at the chance for another closing new high on Friday. There are a large number of equities discussed in today’s morning Investing Strategy Notes. They include …

Stock Market Outlook For Fri May 1 2026 – Overbought But Higher

Prior Trading Day Summary On Thursday earnings from a number of big cap stocks like Alphabet Stock (GOOGL) and Eli Lilly Stock (LLY) helped to push the indexes to new all-time highs yet again. The SPX rose 73 points to …

Morning Investing Strategy Notes for Thu Apr 30 2026

For FullyInformed Members the morning Investing Strategy Notes for Thu Apr 30 2026 look at the odds of a lower day. There are a large number of equities discussed in today’s morning Investing Strategy Notes. They include Alphabet Stock (GOOGL), …

Stock Market Outlook For Thu Apr 30 2026 – Dips Likely Possible Lower Close

Prior Trading Day Summary On Wednesday the SPX closed slightly lower while the NASDAQ closed higher ending the day with a mixed outlook. The SPX fell 3 points to close at 7135 on 5.2 billion shares traded. Just 37% of …

Morning Investing Strategy Notes for Wed Apr 29 2026

For FullyInformed Members the morning Investing Strategy Notes for Wed Apr 29 2026 look at expectations for profits on Wednesday and especially Thursday. There are a large number of equities discussed in today’s morning Investing Strategy Notes. They include Nucor …

Stock Market Outlook For Wed Apr 29 2026 – Choppy But Higher Ahead Of More Earnings

Prior Trading Day Summary On Tuesday both the SPX and NASDAQ lost a little ground but the bigger earnings are set to be released starting tomorrow. The SPX fell 35 points to close at 7178 on 5 billion shares traded …

Morning Investing Strategy Notes for Tue Apr 28 2026

For FullyInformed Members the morning Investing Strategy Notes for Tue Apr 28 2026 look at anticipated market action for today. There are a number of equities discussed in today’s morning Investing Strategy Notes. They include Intel Stock (INTC), Nucor Stock …

Subscribe For The Latest News