

On Friday Aug 23 it was the President tweets about China that sent the markets collapsing lower. From 11:00 AM when President Trump tweeted about increasing tariffs further on Chinese goods, markets slid until ending the day at 2847, 2.6% lower. The collapse saw the index slice through support at 2900, 2875, 2860 and 2850 although it is expected the index will try to recover above 2850 for a bit of time on Monday.
Overall it was the third big collapse in stocks in August alone and many analysts believe this move lower will not be recovered as quickly and the last two were. That though, remains to be seen as the present stock market has been very resilient, recovering quickly losses from the past large down days..
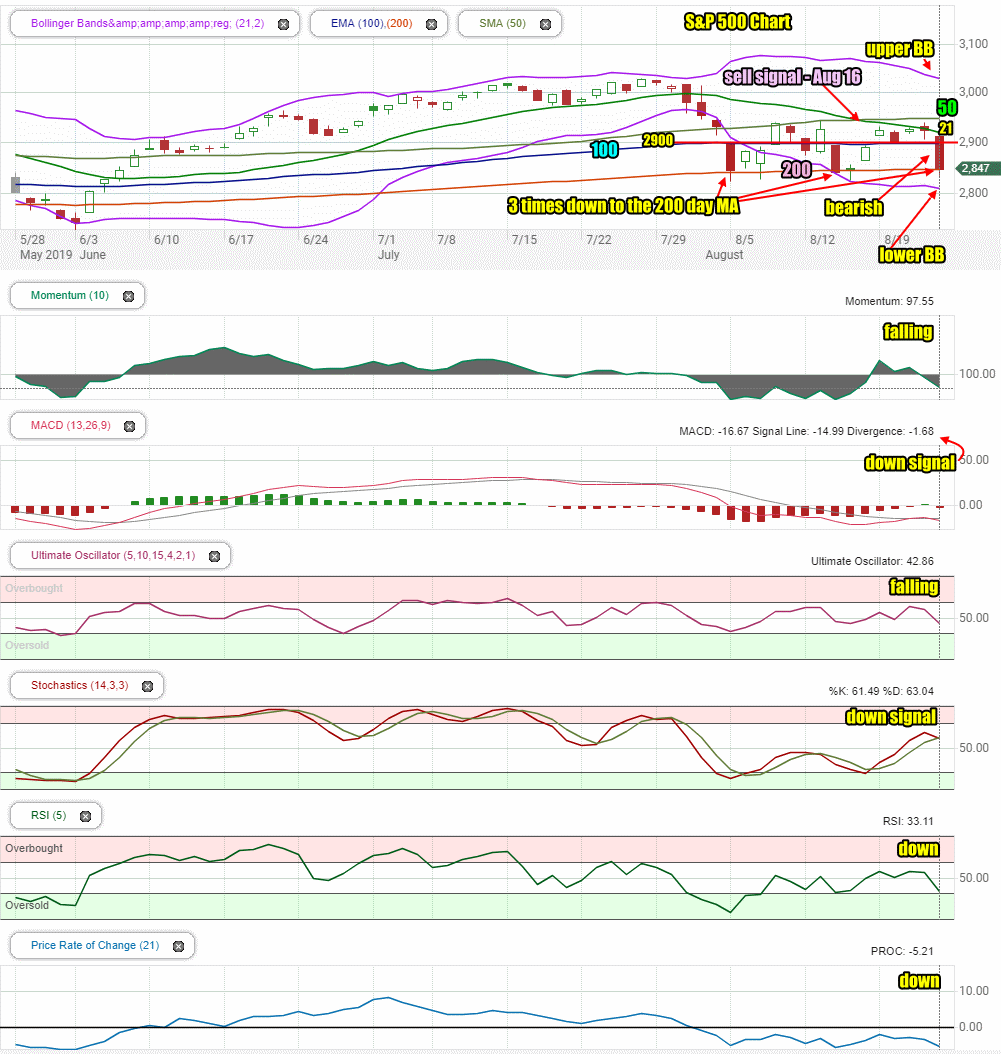
Stock Market Outlook Chart Comments At The Close on Fri Aug 23 2019
For the third time in August the index collapsed on Friday and closed at the 200 day moving average. This is bearish.
The closing candlestick is bearish but also shows an oversold condition which could see a spike higher on Monday.
The sell signal from Aug 16 is still dominant where the 21 day moving average fell below the 50 day moving average.
The 21 and 50 day moving averages are dipping lower. The 100 day is starting to turn away from the 2900 level. The 200 day is the only major moving average that is climbing.
The Bollinger Bands are pointing to more downside ahead for the index.
Stock Market Outlook review of Aug 23 2019
Stock Market Outlook: Technical Indicators Review:
Momentum: Momentum is falling and negative.
- Settings: For momentum I use a 10 period when studying market direction.
MACD Histogram: MACD (Moving Averages Convergence / Divergence) issued a down signal on Thursday July 18. On Friday MACD was back to a sell signal.
- Settings: For MACD Histogram, I am using the Fast Points set at 13, Slow Points at 26 and Smoothing at 9.
Ultimate Oscillator: The Ultimate Oscillator signal is falling and negative.
- Settings: The Ultimate Oscillator settings are: Period 1 is 5, Period 2 is 10, Period 3 is 15, Factor 1 is 4, Factor 2 is 2 and Factor 3 is 1. These are not the default settings but are the settings I use with the S&P 500 chart set for 1 to 3 months.
Slow Stochastic: The Slow Stochastic signal has a down signal in place.
- Settings: For the Slow Stochastic I use the K period of 14 and D period of 3. The Slow Stochastic tries to predict the market direction further out than just one day.
Relative Strength Index: The RSI signal is falling.
- Settings: The relative strength index is set for a period of 5 which gives it 5 days of market movement to monitor. It is often the first indicator to show an overbought or oversold signal.
Rate of Change: The rate of change signal is also falling.
- Settings: Rate Of Change is set for a 21 period. This indicator looks back 21 days and compares price action from the past to the present. With the Rate Of Change, prices are rising when signals are positive. Conversely, prices are falling when signals are negative. As an advance rises the Rate Of Change signal should also rise higher, otherwise the rally is suspect. A decline should see the Rate Of Change fall into negative signals. The more negative the signals the stronger the decline.
Support and Resistance Levels To Be Aware Of:
3000 is resistance
2960 is light resistance
2900 is light resistance
2860 is light support
2840 is support
2800 is strong support
2795 is light support
2745 to 2750 is light support
2725 is light support
2700 is light support
2675 is light support
2650 is support
2625 is light support
2600 is support.
Stock Market Outlook for Tomorrow – Mon Aug 26 2019
For Monday the index is fighting an oversold market but a market filled with worried investors. That means moves in the market will be accentuated. The index is also oversold which could assist in a potential bounce for Monday. However any bounce will not hold on Monday and the index will fall lower.
A new sell signal was generated from MACD which is fairly accurate for spotting changes in the stock market trend.
Monday should see some rally attempts from being oversold but overall the index will end the day lower. Big drops are not expected on Monday.
To a large degree everything now depends on President Trump’s tweets. Any positive tweets on the trade front with China will shoot stocks higher. Any further negative tweets will see stocks move lower. It truly has become, all about the President’s tweets on Twitter.
Stock Market Outlook Archives
Stock Market Outlook For Wed May 6 2026 – Choppy But Higher Still

Morning Investing Strategy Notes for Tue May 5 2026

Stock Market Outlook For Tue May 5 2026 – Overbought and Lower

Morning Investing Strategy Notes for Mon May 4 2026
Stock Market Outlook For Mon May 4 2026 – Dips Likely With Possible Lower Close

Morning Investing Strategy Notes for Fri May 1 2026
Stock Market Outlook For Fri May 1 2026 – Overbought But Higher

Morning Investing Strategy Notes for Thu Apr 30 2026
Stock Market Outlook For Thu Apr 30 2026 – Dips Likely Possible Lower Close
Morning Investing Strategy Notes for Wed Apr 29 2026
Stock Market Outlook For Wed Apr 29 2026 – Choppy But Higher Ahead Of More Earnings

Morning Investing Strategy Notes for Tue Apr 28 2026