
Prior Trading Day Summary:
On Friday Aug 16, stocks took a bit of a breather from being overbought but still closed higher.
The S&P rose 11 points to end the day at 5554. The NASDAQ closed up 37 points ending the day at 17,631.
The S&P is up 6.5% from the August 5 sell-off and the NASDAQ is up an impressive 8%.
It was an incredible week for stocks with the S&P adding on 210 points and the NASDAQ a huge 886 points.
With inflation data continuing to support the theory that inflation is easing but economic data showing the consumer is very much alive, it is once again a goldilocks scenario for investors and they responded by snapping up stocks and leaving the Aug 5 sell-off a fading memory.
Let’s review the closing technical indicators from Fri Aug 16 2024 to see what the signals advise for Mon Aug 19 2024.
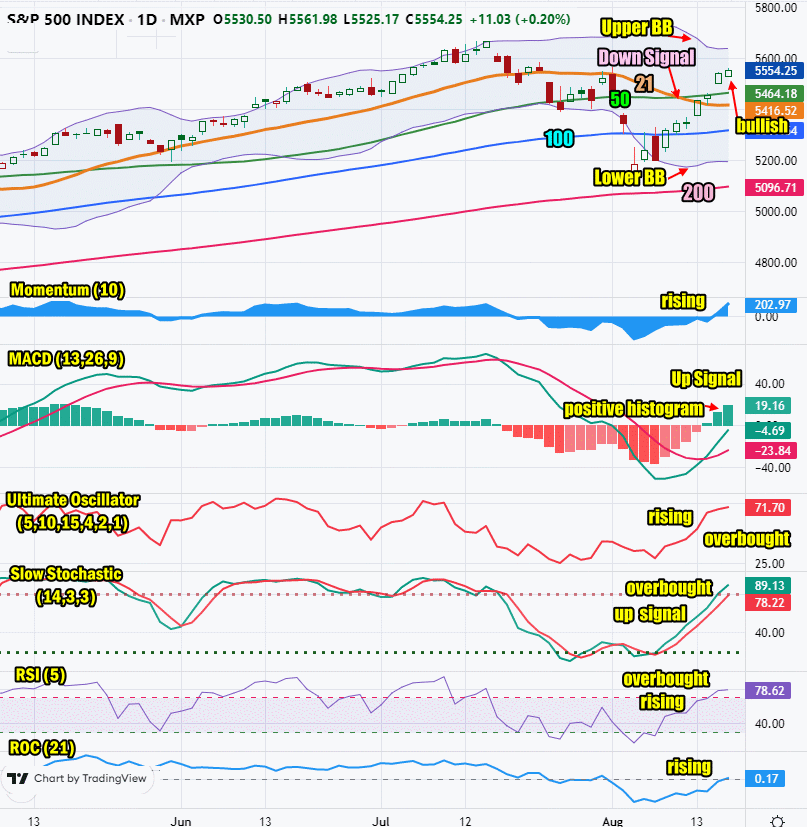
Stock Market Outlook: SPX Closing Chart For Fri Aug 16 2024
The index closed above all the major moving averages on Friday which is bullish.
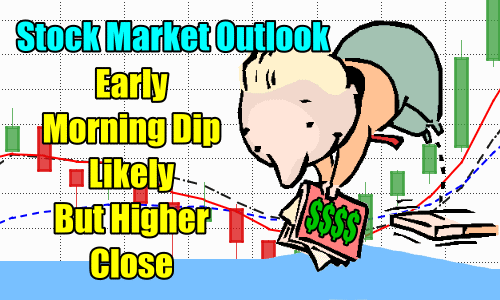
The closing candlestick is bullish but a small shadow on the candlestick indicates some selling held the index back from closing higher. Often that same selling will start the next day’s trading. Watch for morning dips.
The 21 day moving average is turning sideways and could turn back up next week. This is neutral.
The 50 day moving average is back rising and closed at 5464. This is bullish.
The 100 day moving average is rising and closed at 5317 which is bullish.
The 200 day moving average is in an uptrend and closed at 5096 which is bullish.
The Lower Bollinger Band is below the 100 day moving average and has turned sideways which is neutral.
The Upper Bollinger Band is trending sideways which is also neutral.
The S&P chart is more bullish than bearish to start the third week of August.
SPX Stock Market Outlook review of Fri Aug 16 2024
Stock Market Outlook: Technical Indicators Review
Momentum: Momentum is rising and positive. It is not overbought but it is at readings where dips are likely.
|
MACD Histogram: MACD (Moving Averages Convergence / Divergence) issued an up signal on Wed Aug 14 2024. On Fri Aug 16 2024 the up signal gained strength which is readily seen in the histogram.
|
Ultimate Oscillator: The Ultimate Oscillator is rising and positive. It is overbought.
|
Slow Stochastic: The Slow Stochastic has an up signal in place and rising. It is overbought.
|
Relative Strength Index: The RSI signal is rising and positive. It is overbought.
|
Rate of Change: The rate of change signal is rising signaling Monday will end higher.
|
Stock Market Outlook: Support and Resistance Levels |
| 5600 is resistance |
| 5575 is resistance |
| 5550 is resistance |
| 5540 is resistance |
| 5525 is resistance |
| 5500 is resistance |
| 5470 is resistance |
| 5450 is resistance |
| 5425 is resistance |
| 5400 is resistance |
| 5375 is support |
| 5350 is support |
| 5325 is support |
| 5300 is support |
| 5275 is support |
| 5250 is support |
| 5225 is support |
| 5200 is support |
Stock Market Outlook for Mon Aug 19 2024
For Monday the technical indicators are flashing strong overbought signals. The closing candlestick on Friday warned there would be dips today but a higher close is expected. Dips may not last long as buyers will jump in, especially if dips are a bit deeper than expected.
On Wednesday we get the July FOMC minutes which are expected to show no surprises and may end up being a “non-market moving event”. On Friday Fed Chair Powell will be speaking at Jackson Hole and investors and analysts will be listening for any hint of a rate cut for September and how big it could be. The majority of analysts now expect a half point rate decrease.
This week we could see some swings in the overbought market but stocks are positioned to push higher.
Monday should see some sideways motion with dips but a higher close, even by a few points, is expected.
Potential Economic and Political Market Moving Events
Monday:
10:00 Leading economic indicators are expected to drop from 0.2% to -0.4%. This will be in-line with analysts who expect a 50 basis point rate cut in September.