
 Prior Trading Day Summary:
On Friday the non-farm payroll numbers for March were much higher than expected but investors seemed unfazed partly because many of the jobs were part-time. That fed into the theory the Fed will have to lower rates soon.
By the close the SPX was up 57 points recovering almost all of Thursday’s losses. It closed at 5204.
The NASDAQ rose 199 points recovering all 28 points lost on Thursday. The index closed at 16248.52.
For the first week of April the SPX ended down 50 points and the NASDAQ down 131 points but Friday was a strong day for stocks which should help setup the second week of April for a few more gains.
Let’s review the closing technical indicators on Fri Apr 5 2024 to see what to expect for Mon Apr 8 2024.
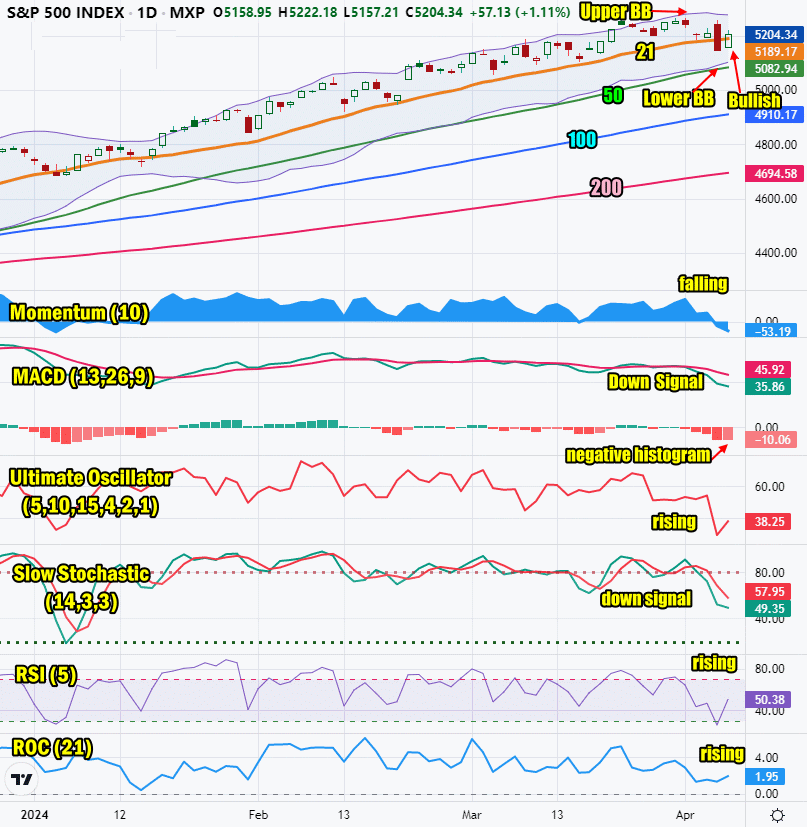
Stock Market Outlook: SPX Closing Chart For Fri Apr 5 2024
The index closed well below the Upper Bollinger Band but back above the 21 day moving average. This is bearish to neutral.
The closing candlestick is signaling the index is positioned to try to move higher on Monday.
The 21 day moving average is now turning sideways which is bearish.
The 50 day moving average is rising and at 5082, which is bullish.
The 100 and 200 day moving averages are climbing which is bullish. The 200 day is at 4694 on the SPX which is bullish.
The Bollinger Bands are moving into the start of another Bollinger Bands Squeeze. The Lower Bollinger Band is turning back up while the Upper Bollinger Band is turning lower. A new Bollinger Bands Squeeze is underway and at present the squeeze looks like it will end with stocks moving lower.
The S&P chart is more bullish than bearish for Monday.
SPX Stock Market Outlook review of Fri Apr 5 2024
Stock Market Outlook: Technical Indicators Review
Momentum: Momentum is falling and negative.
|
MACD Histogram: MACD (Moving Averages Convergence / Divergence) issued a down signal on Tue Apr 2. On Fri Apr 5 2024 the down signal gained strength. The MACD histogram is also strongly negative.
|
Ultimate Oscillator: The Ultimate Oscillator is rising sharply from being oversold.
|
Slow Stochastic: The Slow Stochastic has a down signal in place
|
Relative Strength Index: The RSI signal is rising and back positive.
|
Rate of Change: The rate of change signal is rising indicating Monday will end higher.
|
Stock Market Outlook: Support and Resistance Levels |
| 5275 is resistance |
| 5250 is resistance |
| 5225 is resistance |
| 5200 is resistance |
| 5190 is resistance |
| 5175 is resistance |
| 5150 is resistance |
| 5125 is support |
| 5115 is support |
| 5100 is support |
| 5075 is support |
| 5050 is support |
| 5025 is support |
| 5000 is light support |
| 4990 is light support |
| 4975 is light support |
| 4950 is support |
Stock Market Outlook for Mon Apr 8 2024
The technical indicators mixed to start the second week of April. Friday’s rally was excellent but the indexes still ended the week with losses.
Some signals are positive and point to a higher day while others are negative and point to a lower close.
With the signal mixed, the technical indicators favor the bulls more than the bears. For that reason the outlook is choppy with dip but a higher close but he end of Monday.
Potential Economic and Political Market Moving Events
The major event this week is the Fed’s Beige Book due out Wednesday at 2:00 PM.
Monday:
8:30 Empire State manufacturing survey is expected to come in at -20.9
8:30 Retail sales for March are expected to be unchanged at 0.6%.
10:00 Business inventories are estimated at 0.0%
10:00 Home builder confidence is estimated at 51 for April