
 Prior Trading Day Summary:
One word described Friday April 4 2025 – Brutal.
The S&P collapsed 322 points ending the day at 5074. For the week the S&P was down 507 points. Truly stunning developments and pushing the SPX through a number of key support levels. Volume was 8.9 billion with many investors who bought on Thursday, selling out on Friday. New lows on New York were a staggering 1041. New highs were just 15. I would have to go back a long way to find a day with this many new 52 week lows. 92% of all volume and 90% of all stocks on New York were falling. It was the type of sell-off that I have seen just two or three times before. On March 20 2020, the S&P fell 105 points from a close of 2305 for a drop of 4.5% on one day. On Friday the SPX lost 5.97%.
The NASDAQ collapsed 962 points on Friday, better than Thursday’s plunge of 1050 points. For the week the NASDAQ is down 1735 points. The index closed at 15,587. Volume was 11.2 billion shares traded with 1478 new 52 week lows and 34 new highs. 82% of volume was to the downside and 83% of all stocks were falling. This was a drop of 5.82% on Friday.
Sunday early morning shows another day of carnage developing as other countries decide on their course of action with the EU announcing tariffs along with China. Both are major trading partners.
With stocks set to continue their slide on Monday, we may see another record setting day of volume as many investors will rush to exit, especially those with profits still intact. As well, margin calls will be numerous on Monday which forces more selling. With no news of any assistance from government officials from the White House to the Federal Reserve, Monday is setting up for another record day.
Let’s review the technical indicators at the close on Fri Apr 4 2025 to see what to expect for stocks on Mon Apr 7 2025.
Stock Market Outlook: SPX Closing Chart For Fri Apr 4 2025
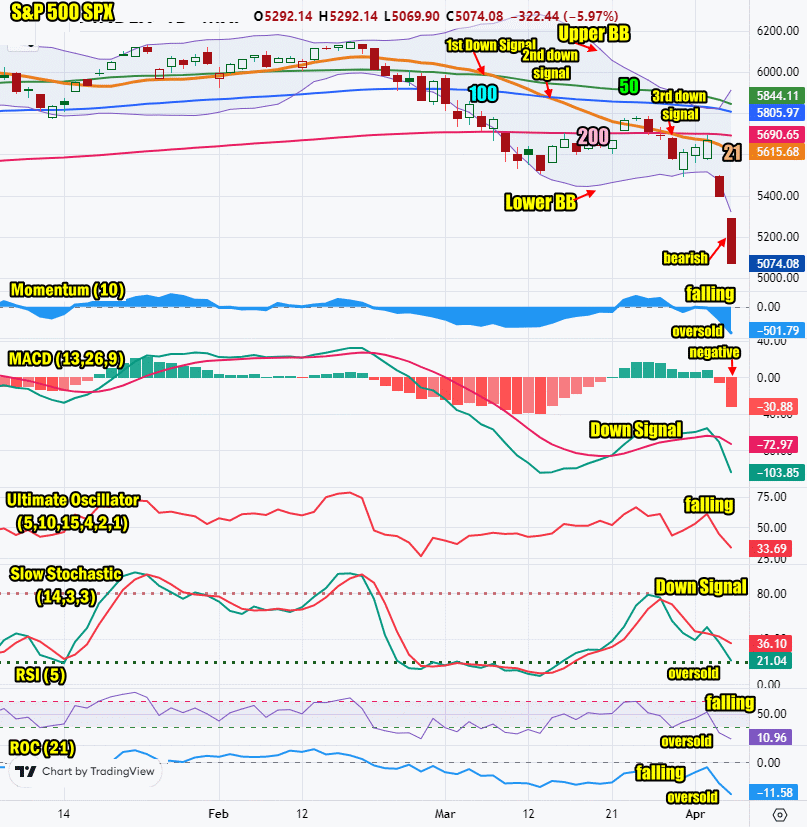
The index closed 616 points below the 200 day moving average . This is extremely bearish and often is followed by another day or even two of selling before a bounce might occur.
The closing candlestick show a deep sell-off with the SPX closing at the lows for the day. This is bearish and points to a potential bounce that will fail at this point in the sell-off.
The 21 day moving average is falling and closed at 5615 which is bearish. The 21 day moving average fell below the 50 day on Friday Mar 7/ It fell below the 100 day on Thursday Mar 13 for a second down signal and on Friday Mar 28 it fell below the 200 day for a third down signal.
The 50 day moving average is falling and closed at 5844 which is bearish.
The 100 day moving average is falling and closed at 5805 which is bearish.
The 200 day moving average is falling and closed at 5690 which is bearish.
The Lower Bollinger Band is falling sharply signaling more downside is ahead. The Upper Bollinger Band is turning sharply higher which signals more downside ahead.
For Monday the SPX chart is still strongly bearish and the closing candlestick is pointing to a possible bounce but it is still pointing lower for equities.
SPX Stock Market Outlook review of Fri Apr 4 2025
Stock Market Outlook: Technical Indicators Review
Momentum: Momentum is falling and negative. It is very oversold.
|
MACD Histogram: MACD (Moving Averages Convergence / Divergence) issued a down signal on Thu Apr 3 2025. On Fri Apr 4 2025 the down signal was confirmed. The down signal is very strong but if you look at the previous down signal in the MACD chart above you can see there is still room for MACD to fall before reaching extremely oversold levels.
|
Ultimate Oscillator: The Ultimate Oscillator is falling and negative. It is down to 33.69 but again you can see in the technical chart that it was down to 25 on Feb 27. That means there is room for stocks to still fall.
|
Slow Stochastic: The Slow Stochastic has a strong down signal in place and is oversold.
|
Relative Strength Index: The RSI signal is falling and extremely oversold and 10.98.
|
| Rate of Change: The rate of change signal is falling sharply signaling a lower close is expected on Monday. Settings: Rate Of Change is set for a 21 period. This indicator looks back 21 days and compares price action from the past to the present. With the Rate Of Change, prices are rising when signals are positive. Conversely, prices are falling when signals are negative. As an advance rises, the Rate Of Change signal should also rise higher, otherwise the rally is suspect. A decline should see the Rate Of Change fall into negative signals. The more negative the signals the stronger the decline. |
Stock Market Outlook: Support and Resistance Levels |
| 5800 is resistance |
| 5775 is resistance |
| 5750 is resistance |
| 5730 is resistance |
| 5700 is resistance |
| 5650 is resistance |
| 5630 is resistance |
| 5600 is support |
| 5585 is support |
| 5550 is support |
| 5500 is support |
| 5450 is support |
| 5400 is support |
| 5230 is support |
| 5000 is support |
| 4770 is support |
| 4680 is support |
| 4500 is support |
| 4365 is support |
| 4150 is support |
| 4000 is support |
Stock Market Outlook for Mon Apr 7 2025
Despite strong March jobs numbers, tariffs hold center stage. Monday looks grim with the SPX down at the 5000 support level and the next support of any real consequence is down at 4770 followed by 4680. YOu can see in the support and resistance chart that stocks are now into technically better support levels. While that may not slow the decline at present, eventually there will be a rally which could be strong due to stocks being so deeply oversold.
For Monday, stocks are set to continue their decline. While a bounce is possible at any time, the chance of a bounce holding is extremely slim. Bounces will be used by investors to get out of positions and move to the sidelines to wait for the market to recover.
This sell-off has been self induced by the President’s stance on tariffs and how they are to be implemented. The markets’ collapse into bear territory was not caused by other events but at present the chance of anyone coming to “rescue” seems unlikely as the Fed is very reluctant to get involved. Caution is advised. Use any spike higher to reduce some exposure and raise capital for when the selling ends.
Potential Economic and Political Market Moving Events
Monday:
3:00 Consumer credit is estimated to decline to $15.5 billion from $18.1 billion prior