
Friday morning saw the S&P slip just below 2920. That brought in the usual buyers who snapped up some of the stocks and pushed the index to 2930. They then moved aside or sold out and the index drifted sideways once again. The final hour of trading saw all the action with the S&P pushing almost to the 52 week high of 2940.91. It closed at 2939.88 a point shy of the all-time high.
Stock Market Outlook Chart Comments At The Close on Friday Apr 26 2019
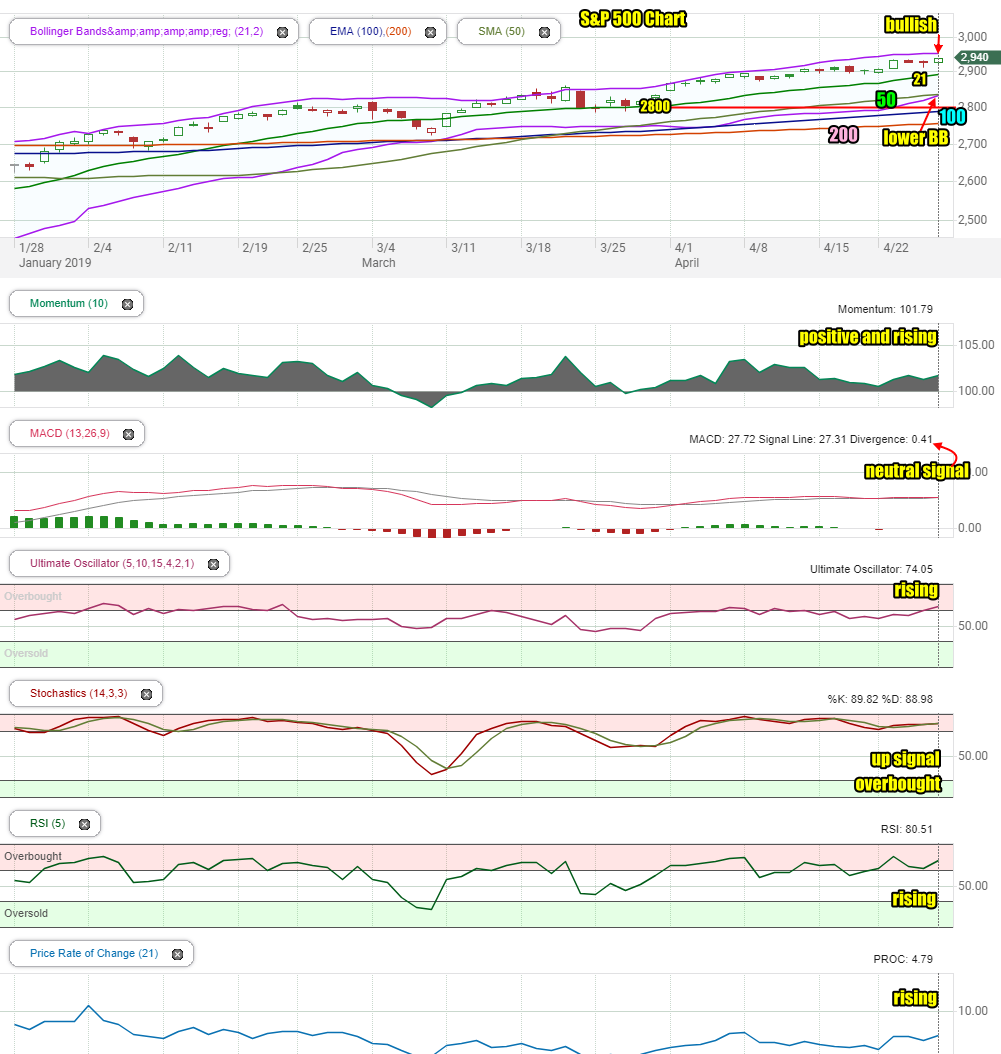
The S&P closed above the 21 day moving average again on Friday and left behind a bullish candlestick for the start of the week.
However the most important thing to observe is the lower Bollinger Band which has climbed back to the 50 day moving average. Often this signals a chance for another Bollinger Bands Squeeze. That will have to be watched to start off the week. If the Lower Bollinger Band moves above the 50 day and the Upper Bollinger Band does not move higher, then we know a new squeeze will occur. More often, that can be bearish as it follows on the heels of another Bollinger Bands Squeeze that ended bullish.
All major moving averages are moving ahead with the 50 day and 100 day both moving away from the 200 day.
The S&P is stronger but it continues to see a lot of sideways action and low volume. Both of these keep the rally higher suspect.
Stock Market Outlook review of Fri Apr 26 2019
Stock Market Outlook: Technical Indicators Review:
Momentum: Momentum is positive and rising.
- Settings: For momentum I use a 10 period when studying market direction.
MACD Histogram: MACD (Moving Averages Convergence / Divergence) issued an up signal on Tuesday April 2. The signal was neutral again on Friday.
- Settings: For MACD Histogram, I am using the Fast Points set at 13, Slow Points at 26 and Smoothing at 9.
Ultimate Oscillator: The Ultimate Oscillator signal is positive and rising.
- Settings: The Ultimate Oscillator settings are: Period 1 is 5, Period 2 is 10, Period 3 is 15, Factor 1 is 4, Factor 2 is 2 and Factor 3 is 1. These are not the default settings but are the settings I use with the S&P 500 chart set for 1 to 3 months.
Slow Stochastic: The Slow Stochastic has a weak up signal in place and is overbought.
- Settings: For the Slow Stochastic I use the K period of 14 and D period of 3. The Slow Stochastic tries to predict the market direction further out than just one day.
Relative Strength Index: The RSI signal is rising.
- Settings: The relative strength index is set for a period of 5 which gives it 5 days of market movement to monitor. It is often the first indicator to show an overbought or oversold signal.
Rate of Change: The rate of change signal is also rising.
- Settings: Rate Of Change is set for a 21 period. This indicator looks back 21 days and compares price action from the past to the present. With the Rate Of Change, prices are rising when signals are positive. Conversely, prices are falling when signals are negative. As an advance rises the Rate Of Change signal should also rise higher, otherwise the rally is suspect. A decline should see the Rate Of Change fall into negative signals. The more negative the signals the stronger the decline.
Support Resistance Levels To Be Aware Of:
2950 is resistance
2900 is light support
2860 is light support
2830 is light support
2800 is strong support
2795 is light support
2745 to 2750 is light support
2725 is light support
2700 is light support
2675 is light support
2650 is support
2625 is light support
2600 is support.
There was good support at the 2550 level which is back to being support.
The 2500 level is support.
The S&P has light support at 2480 and better support at 2450.
There is good support at 2425.
Below that there is some support at 2400, 2380, 2350.
Stock Market Outlook for Tomorrow – Mon Apr 29 2019
The old adage of “never short a dull market” or “a bull market climbs a wall of worry” can both be applied to this market. However having a bit of protection as the index struggles to reach a new high and hold onto that high to build for yet another push up, is probably not a bad idea. The problem for most investors is that buying some Spy Puts means laying out money on an asset that is a wasting asset. In other words, if the market does not fall, the spy puts will lose value every day. I will be posting an article on the members site this evening to outline a different trade that can be considered for a bit of protection.
Despite the grinding higher, the index still is showing technical signs that it will keep moving higher. Monday should see a dip in the morning especially after closing at the highs on Friday. That dip could take the S&P to 2930 but from there I would expect the index to push back and close or at least reach intraday a new all-time high on Monday.
Stock Market Outlook Archives
Stock Market Outlook For Wed May 6 2026 – Choppy But Higher Still

Morning Investing Strategy Notes for Tue May 5 2026

Stock Market Outlook For Tue May 5 2026 – Overbought and Lower

Morning Investing Strategy Notes for Mon May 4 2026
Stock Market Outlook For Mon May 4 2026 – Dips Likely With Possible Lower Close

Morning Investing Strategy Notes for Fri May 1 2026
Stock Market Outlook For Fri May 1 2026 – Overbought But Higher

Morning Investing Strategy Notes for Thu Apr 30 2026
Stock Market Outlook For Thu Apr 30 2026 – Dips Likely Possible Lower Close
Morning Investing Strategy Notes for Wed Apr 29 2026
Stock Market Outlook For Wed Apr 29 2026 – Choppy But Higher Ahead Of More Earnings

Morning Investing Strategy Notes for Tue Apr 28 2026