
Summary:
Friday was another “down” day for the markets. Bonds continued to sell-off with the 10 year yield reaching its highest level in 4 years.
Crude oil prices were climbing until President Trump tweeted that high oil prices would “not be accepted” which dropped prices.
Friday saw old concerns return including tariffs, global trade, inflation and rising interest rates.
Closing Statistics from Fri Apr 20 2018
The S&P fell 22.99 points to 2670.14 losing 0.85%
The NASDAQ Composite fell 91.93 points to 7146.13 down 1.27%
The Dow Jones Industrial Average fell 201.95 points to 24,462.94 losing 0.82%
Stock Market Outlook Chart Comments At The Close on Fri Apr 20 2018
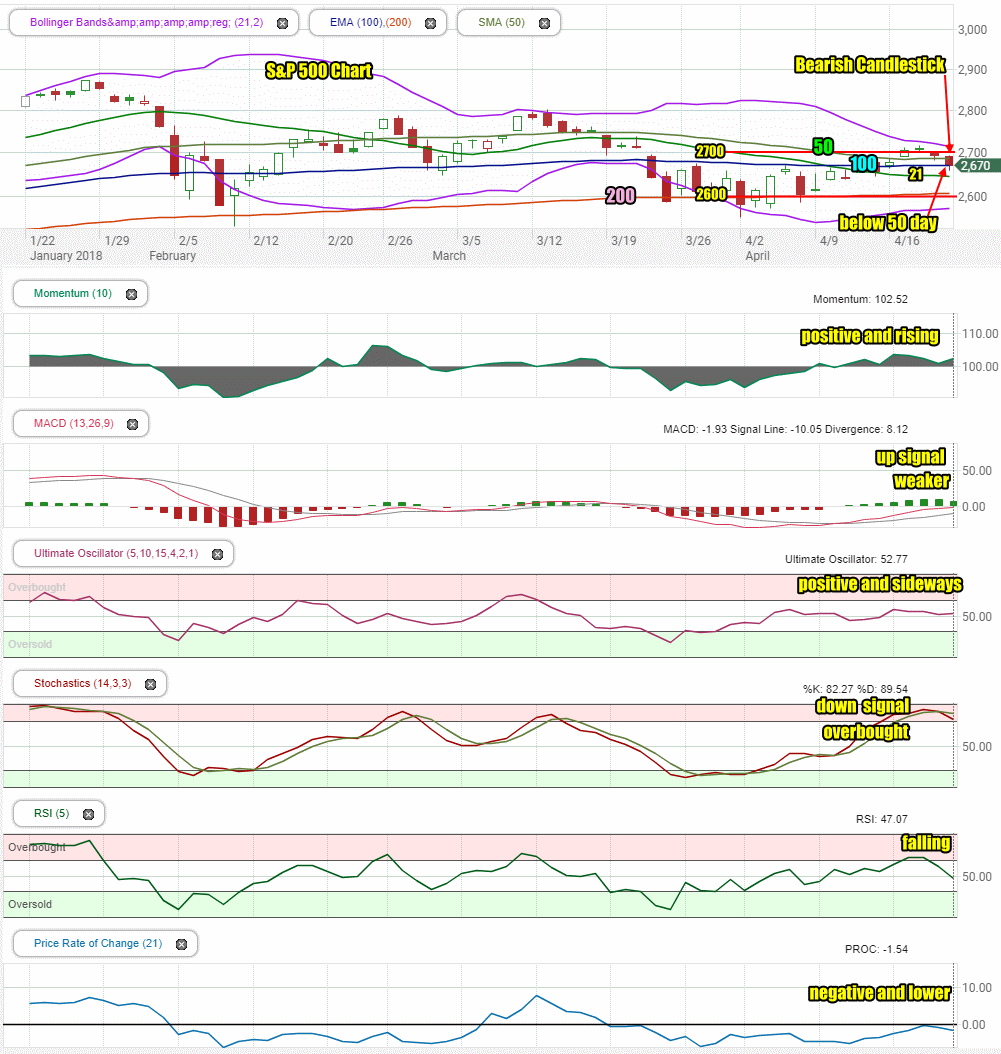
The chart is bearish as of the close on Friday. The index fell through the 50 and 100 day moving averages on Friday before recovering to close at the 100 day moving average.
While the 21, 50 and 100 day moving averages are still falling, the 200 day is rising. The 50 day moving average is leading the market while the 100 day is not far below. The 21 day continues to drift lower and could cross below the 200 day moving average this week, if there is enough selling. That would be very bearish.
The Bollinger Bands Squeeze is continuing to develop and it still looks like it will probably send stocks lower.
Stock Market Outlook review of Fri Apr 20 2018
Stock Market Outlook: Technical Indicators Review:
Momentum: For momentum I use a 10 period when studying market direction. Momentum is positive and rising.
MACD Histogram: For MACD Histogram, I am using the Fast Points set at 13, Slow Points at 26 and Smoothing at 9. MACD (Moving Averages Convergence / Divergence) issued a buy signal on Apr 11. The buy signal weakened further on Friday.
Ultimate Oscillator: The Ultimate Oscillator settings are: Period 1 is 5, Period 2 is 10, Period 3 is 15, Factor 1 is 4, Factor 2 is 2 and Factor 3 is 1. These are not the default settings but are the settings I use with the S&P 500 chart set for 1 to 3 months. The Ultimate Oscillator signal is positive and trending sideways.
Slow Stochastic: For the Slow Stochastic I use the K period of 14 and D period of 3. The Slow Stochastic tries to predict the market direction further out than just one day. The Slow Stochastic has a down signal for Monday.
Relative Strength Index: The relative strength index is set for a period of 5 which gives it 5 days of market movement to monitor. It is often the first indicator to show an overbought or oversold signal. The RSI signal is falling.
Rate of Change: Rate Of Change is set for a 21 period. This indicator looks back 21 days and compares price action from the past to the present. With the Rate Of Change, prices are rising when signals are positive. Conversely, prices are falling when signals are negative. As an advance rises the Rate Of Change signal should also rise higher, otherwise the rally is suspect. A decline should see the Rate Of Change fall into negative signals. The more negative the signals the stronger the decline. The rate of change is negative and falling.
Support Levels To Be Aware Of:
2745 to 2750 was light support
2710 was light support.
2700 is support.
2675 is light support.
2650 is light support and 2620 is also light support.
2600 is good support.
There is good support at the 2550 level from where the market bounced back from the recent correction on Feb 9.
The S&P has light support at 2480. It also has light support at 2450 and good support at 2425. Below that there is some support at 2400, 2380, 2350. 2300 has the most support at present but would represent a full correction as a drop to this level would be 20% and just 5% away from a potential bear market signal.
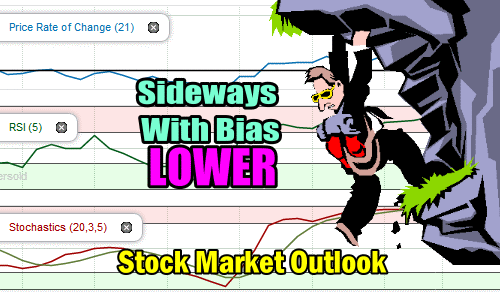
Stock Market Outlook for Tomorrow – Mon Apr 23 2018
The technical indicators are a bit weaker to start off the final week of April.
The Slow Stochastic has a sell signal in place while the Moving Average Convergence / Divergence is still showing a fairly strong up signal.
Momentum and the Ultimate Oscillator are still positive while the Relative Strength Index (RSI) and Rate Of Change are both moving lower.
This gives us a sideways outlook but with a bias to the downside for Monday. The morning should see a spike higher as investors carry on the rally from Friday. That won’t last long, and selling is expected as the morning drags on. The close of the day is expected to be negative although for much of the day I am expecting a sideways market.
Stock Market Outlook Archives
Stock Market Outlook For Wed May 6 2026 – Choppy But Higher Still

Morning Investing Strategy Notes for Tue May 5 2026

Stock Market Outlook For Tue May 5 2026 – Overbought and Lower

Morning Investing Strategy Notes for Mon May 4 2026
Stock Market Outlook For Mon May 4 2026 – Dips Likely With Possible Lower Close

Morning Investing Strategy Notes for Fri May 1 2026
Stock Market Outlook For Fri May 1 2026 – Overbought But Higher

Morning Investing Strategy Notes for Thu Apr 30 2026
Stock Market Outlook For Thu Apr 30 2026 – Dips Likely Possible Lower Close
Morning Investing Strategy Notes for Wed Apr 29 2026
Stock Market Outlook For Wed Apr 29 2026 – Choppy But Higher Ahead Of More Earnings

Morning Investing Strategy Notes for Tue Apr 28 2026