
 Prior Trading Day Summary:
On Thursday April 17 stocks traded in a tighter range with the SPX at a high of 5255 and low of 5238. The close saw the index up 7 points to 5282.70. Volume was 4.7 billion shares traded with 72% of all stocks rising by the close.
The NASDAQ traded 7.2 billion shares, the lowest volume since March 24. 64% of the volume was trading higher by the close with the index down just 20 points to 16,286.
Let’s review the technical indicators from the close on Thu Apr 17 2025 to see what they predict for the start of the fourth week of April..
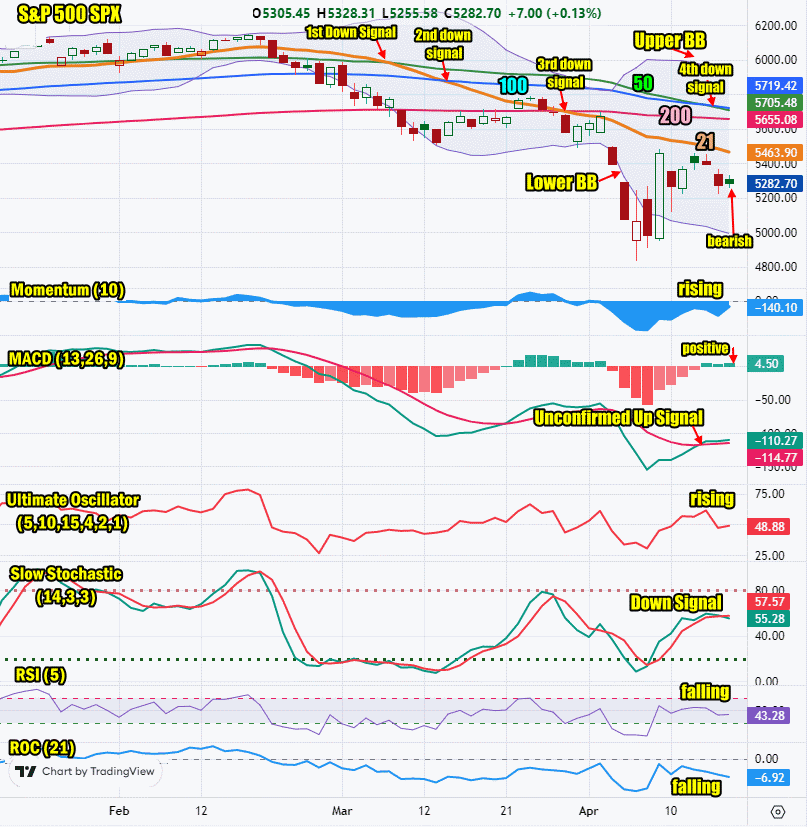
Stock Market Outlook: SPX Closing Chart For Thu Apr 17 2025
The index closed below the 200 day moving average again and below Wednesday’s (Feb 9) high which is bearish.
The closing candlestick has two shadow which indicates another bearish bounce attempt could occur on Monday but the close still appears negative.
The 21 day moving average is falling and closed at 5463. The 21 day moving average fell below the 50 day on Friday Mar 7. It fell below the 100 day on Thursday Mar 13 for a second down signal and on Friday Mar 28 it fell below the 200 day for a third down signal.
The 50 day moving average is falling and closed at 5705 which is bearish. The 50 day moving average fell below the 100 day on Tue April 15. which issues a 4th down signal on the SPX.
The 100 day moving average is falling and closed at 5719 which is bearish.
The 200 day moving average is falling and closed at 5655 which is bearish.
All the moving averages are continuing their decline with four down signals so far in the sell-off.
The Lower Bollinger Band is falling. The Upper Bollinger Band is also falling which is bearish.
For Monday the SPX chart is very bearish and indicates any bounce at present will fail.
SPX Stock Market Outlook of Thu Apr 17 2025
Stock Market Outlook: Technical Indicators Review
Momentum: Momentum is rising and negative.
|
MACD Histogram: MACD (Moving Averages Convergence / Divergence) issued a down signal on Thu Apr 3 2025. On Tue Apr 15 2025 a new but unconfirmed up signal was issued. On Thursday the up signal was still not confirmed but is still present.
|
Ultimate Oscillator: The Ultimate Oscillator is risingand negative. It is not oversold.
|
Slow Stochastic: The Slow Stochastic issued a weak down signal on Thursday.
|
Relative Strength Index: The RSI signal is falling and not oversold.
|
| Rate of Change: The rate of change signal is falling and signaling a lower close for Monday. Settings: Rate Of Change is set for a 21 period. This indicator looks back 21 days and compares price action from the past to the present. With the Rate Of Change, prices are rising when signals are positive. Conversely, prices are falling when signals are negative. As an advance rises, the Rate Of Change signal should also rise higher, otherwise the rally is suspect. A decline should see the Rate Of Change fall into negative signals. The more negative the signals the stronger the decline. |
Stock Market Outlook: Support and Resistance Levels |
| 5700 is resistance |
| 5650 is resistance |
| 5630 is resistance |
| 5600 is resistance |
| 5550 is resistance |
| 5500 is resistance |
| 5450 is resistance |
| 5400 is resistance |
| 5230 is support |
| 5000 is support |
| 4770 is support |
| 4680 is support |
| 4500 is support |
| 4365 is support |
| 4150 is support |
| 4000 is support |
Stock Market Outlook for Mon Apr 21 2025
For Monday the technical signals are still strongly bearish. Only the closing candlestick on Thursday, gave hope of a bounce attempt. All the other signals indicate that any bounce attempt will fail at present.
On Monday watch for a lower open and then mid-morning a bounce attempt. The close though is bearish.
Potential Economic and Political Market Moving Events
Monday:
10:00 Leading economic indicators are estimated slightly lower at -0.5% from -0.3%