

Friday’s rally was built on hopes of products like Gilead Sciences’ antiviral medicine remdesivir getting to patients earlier rather than later, while citizens continue to wait for vaccines to be developed.
The index closed up 75 points for a gain of 2.6%. The index closed at 2874, leaving it within easy reach of 2900.
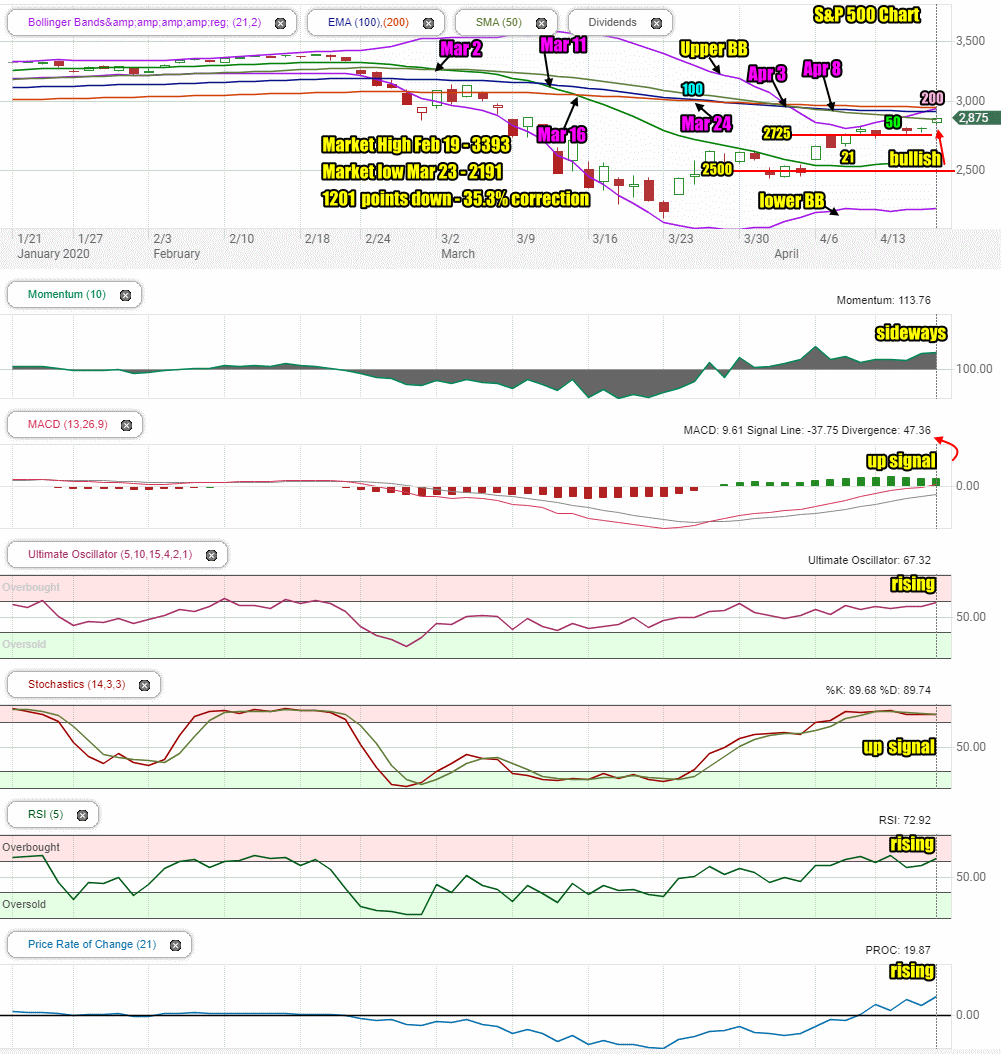
Stock Market Outlook Chart Comments At The Close on Fri Apr 17 2020
The SPX chart continues to be bearish with 6 sell signals in the chart. On Friday the S&P moved to above 2800 and closed at the 50 day moving average. The 2800 has been a tough valuation to break through and hold. Dips back to 2800 this week should be expected but that will to signal a resumption of the downtrend from March.
The 200 day moving average is now leading the market, which is typical in a bear market. It is followed by the 100 day and the 50 day. The 21 day is turning back up.
The closing candlestick on Friday is bullish for the start of the week.
Stock Market Outlook review of For Apr 17 2020
Stock Market Outlook: Technical Indicators Review:
Momentum: Momentum is moving sideways and positive.
- Settings: For momentum I use a 10 period when studying market direction.
MACD Histogram: MACD (Moving Averages Convergence / Divergence) issued an up signal on Thursday March 26. The up signal was strong again on Friday.
- Settings: For MACD Histogram, I am using the Fast Points set at 13, Slow Points at 26 and Smoothing at 9.
Ultimate Oscillator: The Ultimate Oscillator signal is rising.
- Settings: The Ultimate Oscillator settings are: Period 1 is 5, Period 2 is 10, Period 3 is 15, Factor 1 is 4, Factor 2 is 2 and Factor 3 is 1. These are not the default settings but are the settings I use with the S&P 500 chart set for 1 to 3 months.
Slow Stochastic: The Slow Stochastic has an up signal in place and is signaling overbought.
- Settings: For the Slow Stochastic I use the K period of 14 and D period of 3. The Slow Stochastic tries to predict the market direction further out than just one day.
Relative Strength Index: The RSI signal is rising and back into overbought signals.
- Settings: The relative strength index is set for a period of 5 which gives it 5 days of market movement to monitor. It is often the first indicator to show an overbought or oversold signal.
Rate of Change: The rate of change signal is rising , advising that we will see higher prices shortly.
- Settings: Rate Of Change is set for a 21 period. This indicator looks back 21 days and compares price action from the past to the present. With the Rate Of Change, prices are rising when signals are positive. Conversely, prices are falling when signals are negative. As an advance rises the Rate Of Change signal should also rise higher, otherwise the rally is suspect. A decline should see the Rate Of Change fall into negative signals. The more negative the signals the stronger the decline.
Support and Resistance Levels To Be Aware Of:
2900 is resistance
2860 is resistance
2840 is resistance
2800 is resistance
2700 is light support and marked a drop of 20.4%.
2675 is light resistant
2650 is light support
2625 is light support
2600 is support
2550 is light support
2500 was good support and marked a correction of 26.3%
2344 is the next level of support and marks a 30.9% correction.
2100 is light support
2000 is good support and marks a drop of 1393 points for a 41% correction. More analysts are jumping onto this level as where the correction is heading.
Stock Market Outlook for Tomorrow – Mon Apr 20 2020
Friday’s move was almost all pure emotion with investors buying stocks in advance of what they expect will be good news on the Gilead product for treating those infected with Covid-19.
The rally was strong and almost always will see some weakness on the following day.
Monday should see dips which could be a bit deeper than expected but by the close the index should be flat to higher.
At some point this week it should be expected that the index could retest 2800. Many stocks are now back to prices where investors will be considering them fully valued. Moving higher from Friday’s close will mean a belief from investors that the current COVID-19 induced recession will be short-lived and stocks will recover still higher. For that to happen, earnings will have to improve. At present that does not appear to be possible which means any moves still higher should be suspect and investors may want to stay cautionary especially once the index is above 2900. Taking profits, even partial ones and putting in place some protection against a bigger than expected dip might be worth considering as the S&P tries to push higher for the start of the week.
Stock Market Outlook Archives
Stock Market Outlook For Wed May 6 2026 – Choppy But Higher Still

Morning Investing Strategy Notes for Tue May 5 2026

Stock Market Outlook For Tue May 5 2026 – Overbought and Lower

Morning Investing Strategy Notes for Mon May 4 2026
Stock Market Outlook For Mon May 4 2026 – Dips Likely With Possible Lower Close

Morning Investing Strategy Notes for Fri May 1 2026
Stock Market Outlook For Fri May 1 2026 – Overbought But Higher

Morning Investing Strategy Notes for Thu Apr 30 2026
Stock Market Outlook For Thu Apr 30 2026 – Dips Likely Possible Lower Close
Morning Investing Strategy Notes for Wed Apr 29 2026
Stock Market Outlook For Wed Apr 29 2026 – Choppy But Higher Ahead Of More Earnings

Morning Investing Strategy Notes for Tue Apr 28 2026