

The day after Memorial Day holiday, Tuesday saw some rather lackluster trading as oil prices moved lower. Energy stocks pulled back along with bank stocks leaving all three indexes with slight losses.
S&P Index Close
The S&P index ended the day down 2.91 points to close at 2412.91
Dow Jones Index Close
The Dow Jones ended down 50.81 to close at 21,029.47
NASDAQ Index Close
The NASDAQ closed down 7 points to end the day at 6203.19
Stock Market Outlook
Chart Comments At The Close:
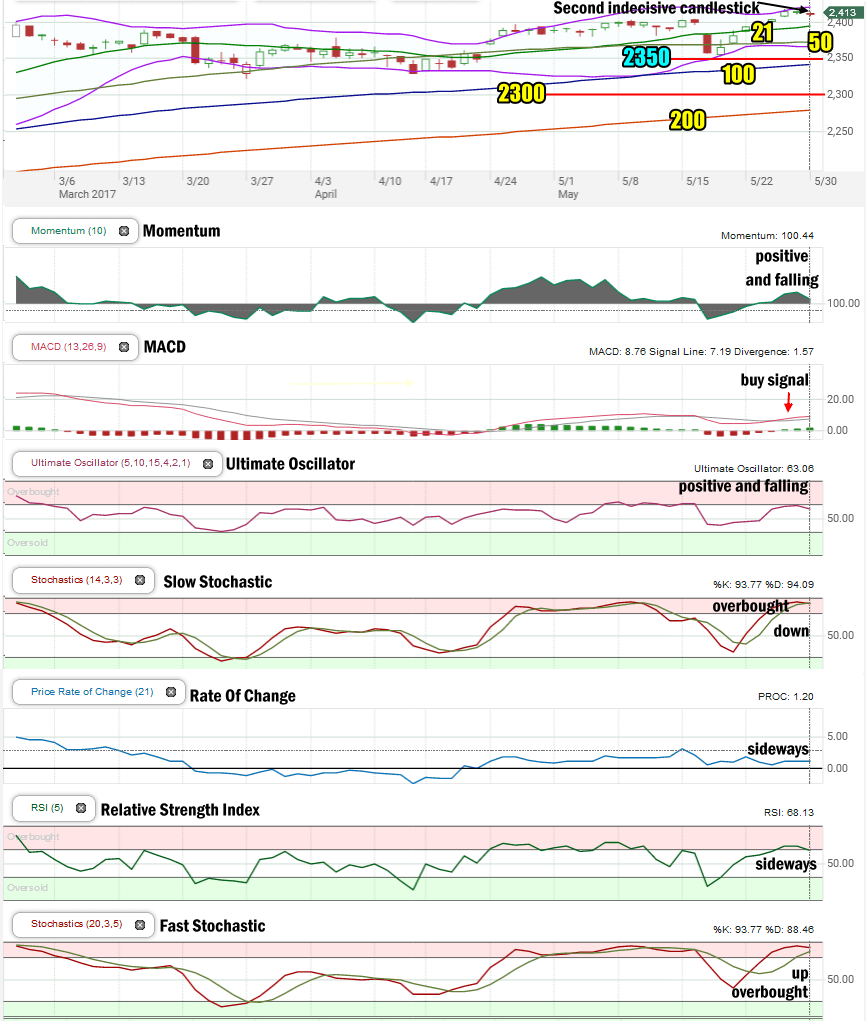
Tuesday close was with only a slight loss but it marks the second day that the S&P index slipped lower below the Upper Bollinger Band. The closing candlestick was almost a repeat of Friday’s. It signals indecision among investors. All the major moving averages are continuing to rise.
Stock Market Outlook review of May 30 2017
Stock Market Outlook: Technical Indicators:
Momentum: For momentum I use a 10 period when studying market direction. Momentum is positive but falling back.
MACD Histogram: For MACD Histogram, I am using the Fast Points set at 13, Slow Points at 26 and Smoothing at 9. MACD (Moving Averages Convergence / Divergence) issued a buy signal on May 25 2017. The buy signal continued on Tuesday.
Ultimate Oscillator: The Ultimate Oscillator settings are: Period 1 is 5, Period 2 is 10, Period 3 is 15, Factor 1 is 4, Factor 2 is 2 and Factor 3 is 1. These are not the default settings but are the settings I use with the S&P 500 chart set for 1 to 3 months. The Ultimate Oscillator is positive and falling.
Slow Stochastic: For the Slow Stochastic I use the K period of 14 and D period of 3. The Slow Stochastic tries to predict the market direction further out than just one day. The Slow Stochastic has a down signal in place after the close today. It is also overbought.
Rate of Change: Rate Of Change is set for a 21 period. This indicator looks back 21 days and compares price action from the past to the present. The rate of change signal is positive but continuing to move sideways which indicates no large move higher or lower is expected.
Relative Strength Index: The relative strength index is set for a period of 5 which gives it 5 days of market movement to monitor. It often is the first indicator to show an overbought or oversold signal. The RSI signal is moving sideways and slightly overbought.
Fast Stochastic: For the Fast Stochastic I use the K period of 20 and D period of 5. These are not default settings, but settings I use for the 1 to 3 month S&P 500 chart when I have it set for daily views. The Fast Stochastic has an up signal in place and is overbought.
Support Levels To Be Aware Of:
The market has light support at the 2380 level, 2350, 2300 and the 2250 level. There is also light support at 2195 but better support is at 2180 and then 2150.
Stock Market Outlook for Tomorrow – Wed May 31 2017
For Wednesday the technical indicators remain bullish although there is weakness starting to develop. We also saw the first sell signal in this rally. This came from the Slow Stochastic which looks out more than a day so we may see further weakness by Thursday or even Friday. We won’t know until we review the readings on Wednesday after the close.
However the indicators are still bullish on the market for Wednesday. We could see some selling on Wednesday, but the bias remains up.
Stay FullyInformed With Email Updates
Market Direction Internal Links
Profiting From Understanding Market Direction (Articles Index)
Understanding Short-Term Signals
Market Direction Portfolio Trades (Members)
Market Direction External Links
IWM ETF Russell 2000 Fund Info
Market Direction SPY ETF 500 Fund Info