

Friday saw low volume ahead of the Memorial Day long weekend. The outlook had been for a flat day for stocks which is what we saw. Tuesday May 30 though, should be different.
S&P Index Close
The S&P index ended the day up 0.75 points to close at 2415.82
Dow Jones Index Close
The Dow Jones ended down 2.67 to close at 21,080.28
NASDAQ Index Close
The NASDAQ closed up 4.93 points to end the day at 6210.19
Stock Market Outlook
Chart Comments At The Close:
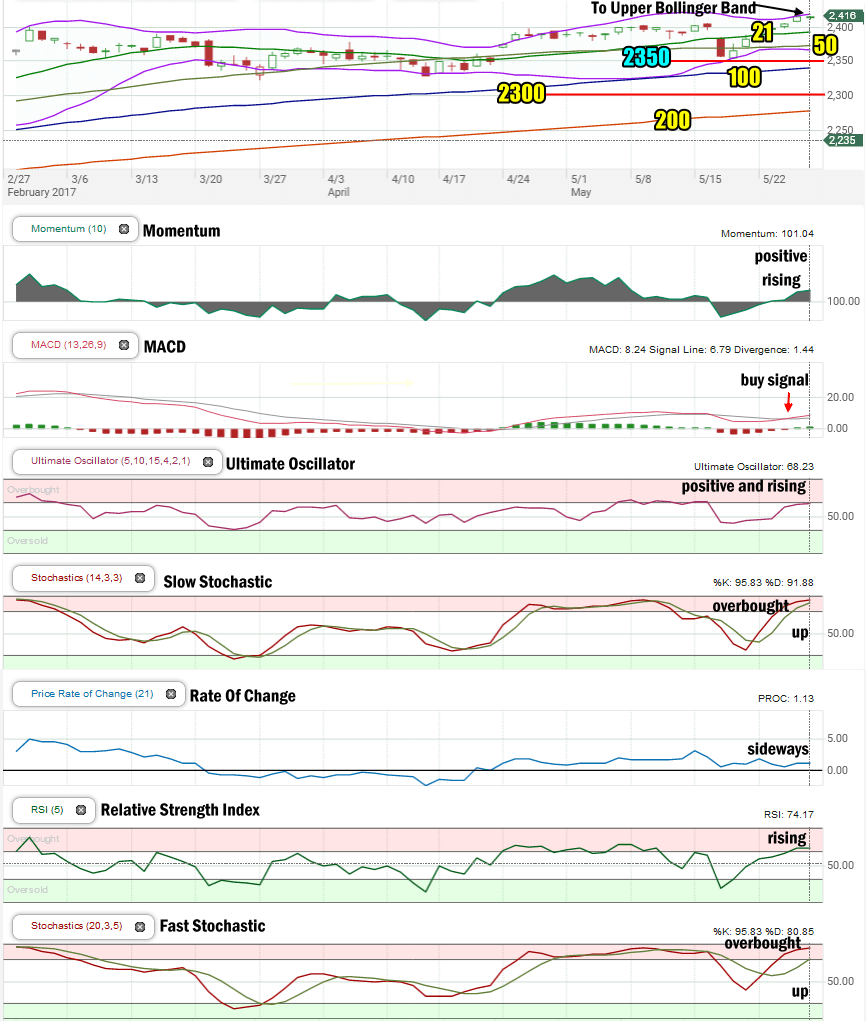
Friday’s close saw the S&P Index holding just below the Upper Bollinger Band. The most important thing on Friday was the closing candlestick which showed strong indecision on the part of investors. That probably means a weak opening for the morning on Tuesday May 30 2017.
Stock Market Outlook review of May 26 2017
Stock Market Outlook: Technical Indicators:
Momentum: For momentum I use a 10 period when studying market direction. Momentum is positive and continuing to climb.
MACD Histogram: For MACD Histogram, I am using the Fast Points set at 13, Slow Points at 26 and Smoothing at 9. MACD (Moving Averages Convergence / Divergence) issued a buy signal on May 25 2017. The buy signal was confirmed on Friday.
Ultimate Oscillator: The Ultimate Oscillator settings are: Period 1 is 5, Period 2 is 10, Period 3 is 15, Factor 1 is 4, Factor 2 is 2 and Factor 3 is 1. These are not the default settings but are the settings I use with the S&P 500 chart set for 1 to 3 months. The Ultimate Oscillator is positive and rising as it nears overbought readings.
Slow Stochastic: For the Slow Stochastic I use the K period of 14 and D period of 3. The Slow Stochastic tries to predict the market direction further out than just one day. The Slow Stochastic has an up signal and is overbought.
Rate of Change: Rate Of Change is set for a 21 period. This indicator looks back 21 days and compares price action from the past to the present. The rate of change signal is positive but continuing to move sideways which indicates no large move higher or lower is expected.
Relative Strength Index: The relative strength index is set for a period of 5 which gives it 5 days of market movement to monitor. It often is the first indicator to show an overbought or oversold signal. The RSI signal is moving into an oversold signal.
Fast Stochastic: For the Fast Stochastic I use the K period of 20 and D period of 5. These are not default settings, but settings I use for the 1 to 3 month S&P 500 chart when I have it set for daily views. The Fast Stochastic has an up signal in place and is overbought.
Support Levels To Be Aware Of:
The market has light support at the 2380 level, 2350, 2300 and the 2250 level. There is also light support at 2195 but better support is at 2180 and then 2150.
Stock Market Outlook for Tomorrow – Tuesday May 30 2017
For Tuesday the technical indicators are still overly bullish. The closing candlestick however showed indecision among investors which probably will result in some weakness and a dip on Tuesday in the early morning.
However the indicators are strong enough that they point to a higher close on Tuesday.
Stay FullyInformed With Email Updates
Market Direction Internal Links
Profiting From Understanding Market Direction (Articles Index)
Understanding Short-Term Signals
Market Direction Portfolio Trades (Members)
Market Direction External Links
IWM ETF Russell 2000 Fund Info
Market Direction SPY ETF 500 Fund Info