

Thursday saw a third straight day of rallying and despite the strength of the rally, it has actually been typical of a bear market rally. Rallies in bear markets can be brutally swift. Just as markets plunged in breath-taking, they can also rally back with equal speed. The rally has been wonderful to see, but it has recovered 50% of the drop from 3100, a typical bear market rally.
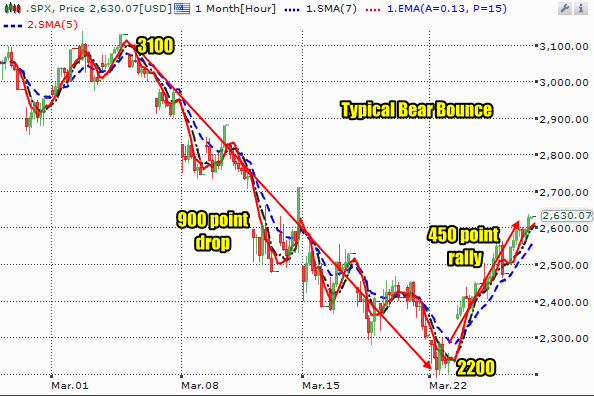
Typical bear bounce
Stock Market Outlook Chart Comments At The Close on Thu Mar 26 2020
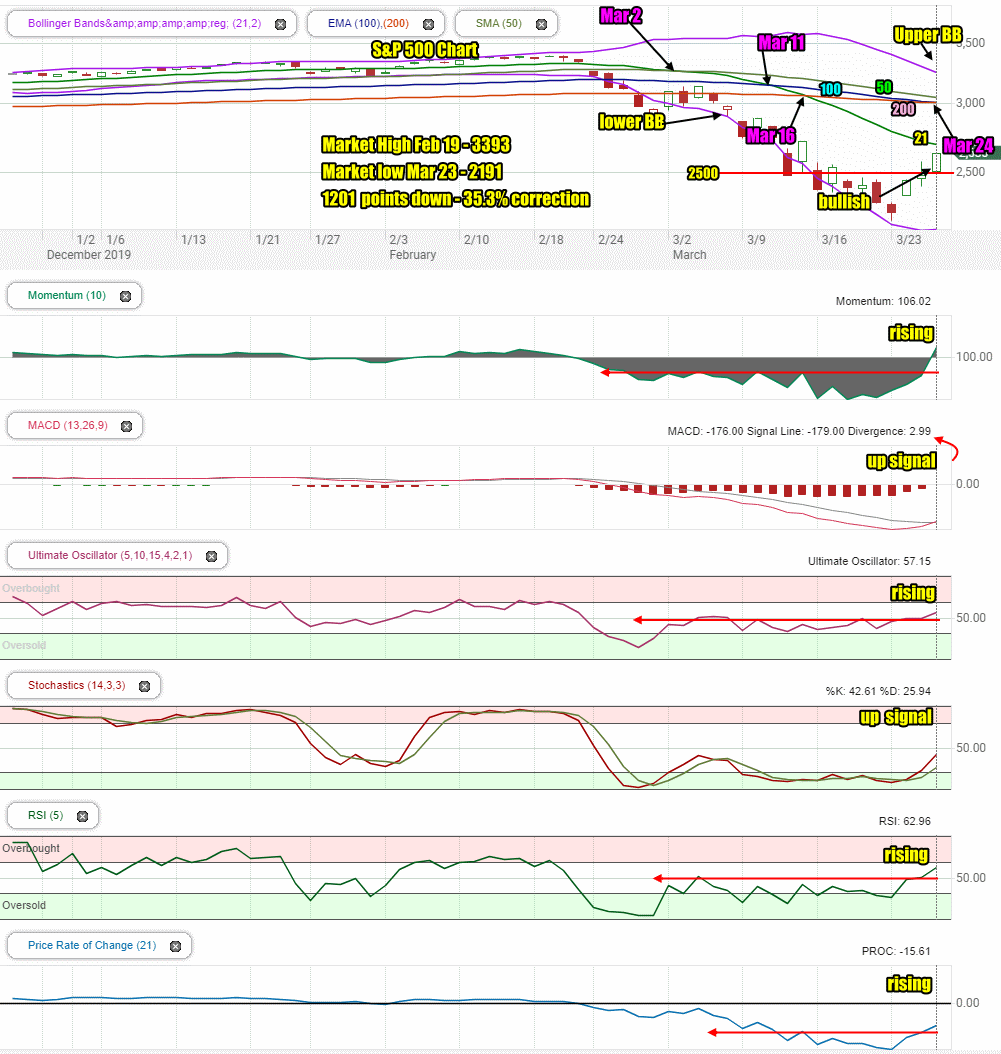
The SPX chart continues to be bearish.
There are now 4 sell signals on the market which are in the chart below in pink.
All the moving averages are plunging but the 21 day is in a relentless tumble lower.
Overall the chart is ugly for equities. One good indicator is the Lower Bollinger Band which is trying to turn sideways, which if it does would indicate the index is trying to make a bottom of sorts.
Yesterday (Wednesday) the closing candlestick warned that either Thursday or Friday would be weak and see the index give back some gains. The closing candlestick today is bullish but also closed that the high of the day. Almost always the candlestick from the prior day (Wednesday) will win out. Friday should be lower.
Stock Market Outlook review of Thu Mar 26 2020
Stock Market Outlook: Technical Indicators Review:
Momentum: Momentum is rising and finally turned positive. It broke through the prior resistance as you can see in the chart above, drawn with a red line in the momentum indicator.
- Settings: For momentum I use a 10 period when studying market direction.
MACD Histogram: MACD (Moving Averages Convergence / Divergence) issued a down signal on Friday Feb 21. On Thursday MACD issued an unconfirmed up signal. Remember – it’s not confirmed.
- Settings: For MACD Histogram, I am using the Fast Points set at 13, Slow Points at 26 and Smoothing at 9.
Ultimate Oscillator: The Ultimate Oscillator signal is also rising and now above its resistance line.
- Settings: The Ultimate Oscillator settings are: Period 1 is 5, Period 2 is 10, Period 3 is 15, Factor 1 is 4, Factor 2 is 2 and Factor 3 is 1. These are not the default settings but are the settings I use with the S&P 500 chart set for 1 to 3 months.
Slow Stochastic: The Slow Stochastic has an up signal in place and is not oversold.
- Settings: For the Slow Stochastic I use the K period of 14 and D period of 3. The Slow Stochastic tries to predict the market direction further out than just one day.
Relative Strength Index: The RSI signal is rising and moved above the resistance line.
- Settings: The relative strength index is set for a period of 5 which gives it 5 days of market movement to monitor. It is often the first indicator to show an overbought or oversold signal.
Rate of Change: The rate of change signal is also rising and broke above its resistance line.
- Settings: Rate Of Change is set for a 21 period. This indicator looks back 21 days and compares price action from the past to the present. With the Rate Of Change, prices are rising when signals are positive. Conversely, prices are falling when signals are negative. As an advance rises the Rate Of Change signal should also rise higher, otherwise the rally is suspect. A decline should see the Rate Of Change fall into negative signals. The more negative the signals the stronger the decline.
Support and Resistance Levels To Be Aware Of:
2700 is strong resistance and was a drop of 20.4%.
2675 is light resistant
2650 is resistance
2625 is light resistance
2600 is resistance
2550 is light resistance
2500 was good support and marked a correction of 26.3%
2344 is the next level of support and marks a 30.9% correction.
2100 is light support
2000 is good support and marks a drop of 1393 points for a 41% correction. More analysts are jumping onto this level as where the correction is heading.
Stock Market Outlook for Tomorrow – Fri Mar 27 2020
Twice this week I have written that I thought the index would end lower and twice the index has risen stronger.
For Friday MACD gave an up signal on the index, the first up signal from MACD since Feb 21. However the rally has recovered almost exactly 50% of the decline from 3100. That, to me, is just too typical of a bear market rally, to believe that the worst is over and the index has entered a new bull market. After having gone through the credit crisis bear market which saw at least two and possibly three of these types of rallies and the bear of 2001 to 2003 which also had spectacular bear market rallies, I will want to see more new highs and more closes to the upside before I believe this is not a bear market rally that will pullback.
For Friday MACD may confirm the up signal and I would love that, but looking at the stats, I still think this is a bear market rally and Friday will see a lower day. I hope I am wrong.
Stock Market Outlook Archives
Stock Market Outlook For Wed May 6 2026 – Choppy But Higher Still

Morning Investing Strategy Notes for Tue May 5 2026

Stock Market Outlook For Tue May 5 2026 – Overbought and Lower

Morning Investing Strategy Notes for Mon May 4 2026
Stock Market Outlook For Mon May 4 2026 – Dips Likely With Possible Lower Close

Morning Investing Strategy Notes for Fri May 1 2026
Stock Market Outlook For Fri May 1 2026 – Overbought But Higher

Morning Investing Strategy Notes for Thu Apr 30 2026
Stock Market Outlook For Thu Apr 30 2026 – Dips Likely Possible Lower Close
Morning Investing Strategy Notes for Wed Apr 29 2026
Stock Market Outlook For Wed Apr 29 2026 – Choppy But Higher Ahead Of More Earnings

Morning Investing Strategy Notes for Tue Apr 28 2026