
Friday saw stocks open, dip lower and then stage an impressive rally which took the index all the way to above 2450. Selling though erupted and the rally fell apart. The week ended strongly negative marking the worst week for the indexes since the credit crisis. It also setup Monday for a another tumultuous day.
Stock Market Outlook Chart Comments At The Close on Fri Mar 20 2020
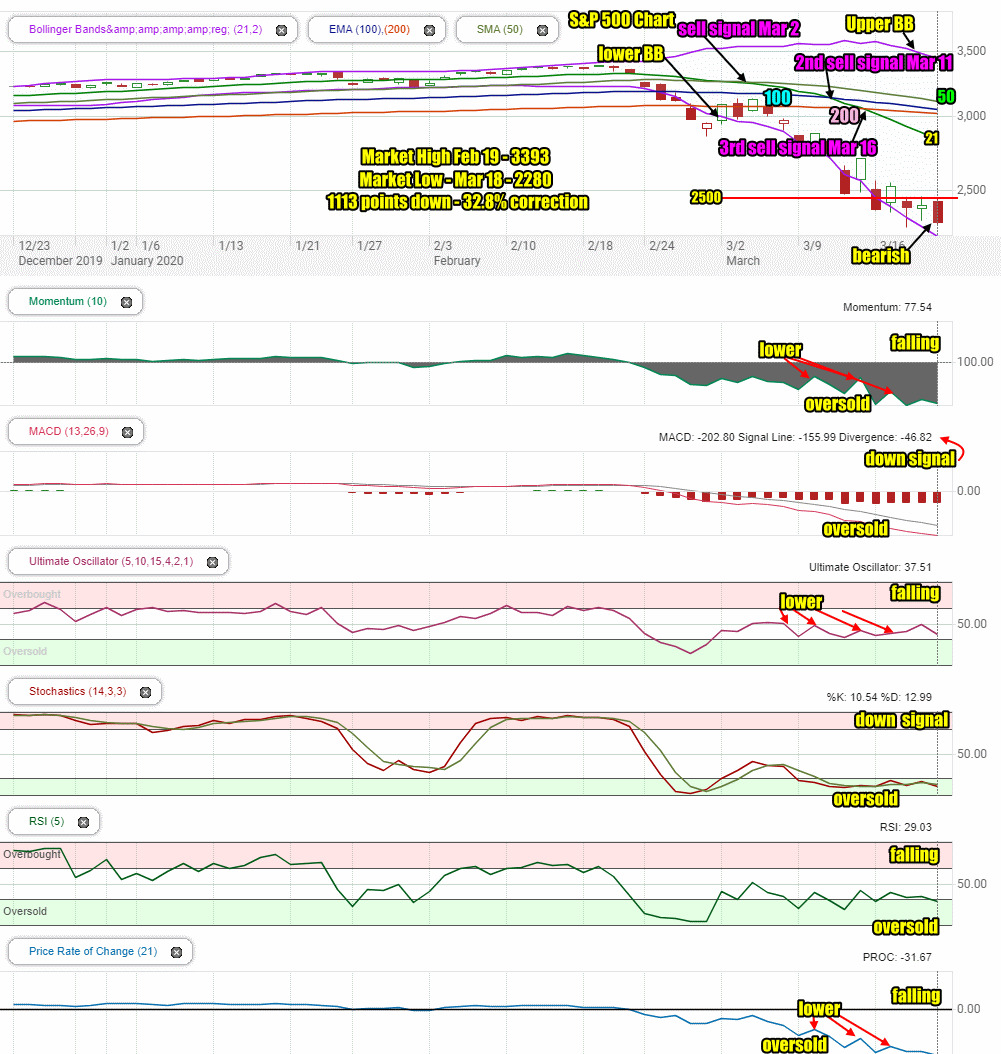
The SPX chart continues to be very bearish. On Friday the S&P ended the day at 2304.92. This marked the third day of testing the 2344 for support. That support is now breaking and the index is set to move to the next level of support which is down at 2150 and then 2100. Neither are strong levels of support. The next major support level is 2000 and would mark a correction of 1393 points for a 41% correction.
Friday’s closing candlestick is bearish. It was once again inside the Lower Bollinger Band which gives it room to tumble.
The Upper Bollinger Band is continuing to turn down which indicates more downside ahead and the 3 sell signals in the chart are gaining momentum to the downside. The 100 day moving average appears ready to fall below the 200 day moving average which is another major sell signal.
All the moving averages are moving lower with the 50 day back below 3200 and the 21 day falling well below the 3000 valuation.
The Lower Bollinger Band is falling rapidly which is a signal for more downside still ahead.
Overall the chart is ugly for equities and although the past week saw the market try to move sideways, it won’t stop falling until signs appear that the spread of the virus is not going to worsen. Fear continues to dominate stocks although surprisingly the VIX closed down 8.2% to 66.04 on Friday.
Stock Market Outlook review of For Mar 20 2020
Stock Market Outlook: Technical Indicators Review:
Momentum: Momentum is falling, negative and oversold. It is very bearish showing a strong declining balance and unable to break the downtrend at present.
- Settings: For momentum I use a 10 period when studying market direction.
MACD Histogram: MACD (Moving Averages Convergence / Divergence) issued a down signal on Friday Feb 21. The down signal is still quite strong but it did lose a bit of strength over the past 3 trading days. Despite this it is strongly negative.
- Settings: For MACD Histogram, I am using the Fast Points set at 13, Slow Points at 26 and Smoothing at 9.
Ultimate Oscillator: The Ultimate Oscillator signal is falling but still moving more sideways than up or down and it shows a pattern of lower spikes. That needs to reverse.
- Settings: The Ultimate Oscillator settings are: Period 1 is 5, Period 2 is 10, Period 3 is 15, Factor 1 is 4, Factor 2 is 2 and Factor 3 is 1. These are not the default settings but are the settings I use with the S&P 500 chart set for 1 to 3 months.
Slow Stochastic: The Slow Stochastic has a down signal in place and is extremely oversold.
- Settings: For the Slow Stochastic I use the K period of 14 and D period of 3. The Slow Stochastic tries to predict the market direction further out than just one day.
Relative Strength Index: The RSI signal is back falling and oversold.
- Settings: The relative strength index is set for a period of 5 which gives it 5 days of market movement to monitor. It is often the first indicator to show an overbought or oversold signal.
Rate of Change: The rate of change signal is moving lower and oversold. Each prior spike higher has also been lower which again we need to see reverse. Right now the rate of change is indicating prices are going to continue to fall.
- Settings: Rate Of Change is set for a 21 period. This indicator looks back 21 days and compares price action from the past to the present. With the Rate Of Change, prices are rising when signals are positive. Conversely, prices are falling when signals are negative. As an advance rises the Rate Of Change signal should also rise higher, otherwise the rally is suspect. A decline should see the Rate Of Change fall into negative signals. The more negative the signals the stronger the decline.
Support and Resistance Levels To Be Aware Of:
2700 is strong resistance and was a drop of 20.4%.
2675 is light resistant
2650 is resistance
2625 is light resistance
2600 is resistance
2550 is light resistance
2500 was good support and marked a correction of 26.3%
2344 is the next level of support and marks a 30.9% correction.
2100 is light support
2000 is good support and marks a drop of 1393 points for a 41% correction. More analysts are jumping onto this level as where the correction is heading.
Stock Market Outlook for Tomorrow – Mar 23 2020
News Sunday evening that the Coronavirus stimulus bill failed to meet Democratic support in the Senate and with both sides unable to reach a compromise, sent stock futures tumbling. These kinds of actions on the part of the government continue to add to the volatility as investors remain of the opinion the government does not have a “handle” on the situation. This just adds to the “panic” on Wall Street. At some point a deal will be reached but for Monday the outlook remains lower. The chance the S&P will fall as low as 2000 is high as more testing will boost the number of infected and unless there are signs of a flattening of the number of cases, the index will probably fall the remaining 300 points or roughly another 13%.
For Monday the outlook is cautionary and lower with the S&P within easy reach of 2200.
There will be new notes this evening for members in the market direction portfolios. I will have them up shortly and will post when they are available.
Stock Market Outlook Archives
Stock Market Outlook For Wed May 6 2026 – Choppy But Higher Still

Morning Investing Strategy Notes for Tue May 5 2026

Stock Market Outlook For Tue May 5 2026 – Overbought and Lower

Morning Investing Strategy Notes for Mon May 4 2026
Stock Market Outlook For Mon May 4 2026 – Dips Likely With Possible Lower Close

Morning Investing Strategy Notes for Fri May 1 2026
Stock Market Outlook For Fri May 1 2026 – Overbought But Higher

Morning Investing Strategy Notes for Thu Apr 30 2026
Stock Market Outlook For Thu Apr 30 2026 – Dips Likely Possible Lower Close
Morning Investing Strategy Notes for Wed Apr 29 2026
Stock Market Outlook For Wed Apr 29 2026 – Choppy But Higher Ahead Of More Earnings

Morning Investing Strategy Notes for Tue Apr 28 2026