FullyInformed.com
Generic filters
Exact matches only
Search in title
Search in content
Search in excerpt

Stock Market Outlook for June 26 2017 – Still Sideways With Bias Lower

Jun 26, 2017 | Stock Market Outlook

Stock Market Outlook - Sideways Bias LowerFriday saw oil prices try to stabilize which helped the markets but then financials moved lower despite passing the latest stress tests. Friday ended the day being mixed with slight losses on the Dow and slight gains on the S&P. The best index for the day was the NASDAQ but in general all the indexes are basically moving sideways, day after day.

S&P Index Close

The S&P index ended the day up 3.8 points to close at 2438.30

Dow Jones Index Close

The Dow Jones ended down 2.53 at 21,394.76

NASDAQ Index Close

The NASDAQ closed up 28.56 points to end the day at 6265.25


Stock Market Outlook

Chart Comments At The Close:

The S&P is still holding above the 2425 level and closed on Friday at the 21 day moving average. The closing candlestick on Friday was neutral on the outlook for Monday. The Bollinger Bands Squeeze continues to form up with no clear signal which way stocks will move once the Bollinger Bands Squeeze gets going this week. All the major moving averages are continuing higher.
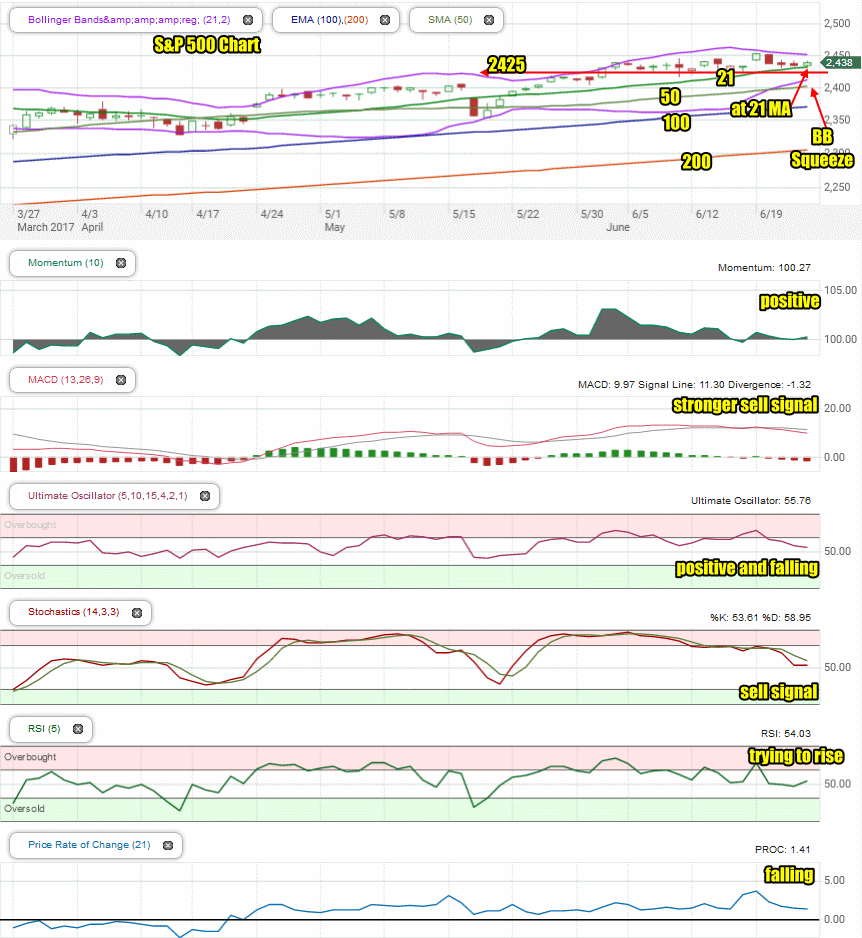
S&P June 23 2017

Stock Market Outlook: Technical Indicators:

Momentum: For momentum I use a 10 period when studying market direction. Momentum is slightly positive but more neutral than either up or down.

MACD Histogram: For MACD Histogram, I am using the Fast Points set at 13, Slow Points at 26 and Smoothing at 9. MACD (Moving Averages Convergence / Divergence) has issued a sell signal on June 20. On Friday the sell signal strengthened.

Ultimate Oscillator: The Ultimate Oscillator settings are: Period 1 is 5, Period 2 is 10, Period 3 is 15, Factor 1 is 4, Factor 2 is 2 and Factor 3 is 1. These are not the default settings but are the settings I use with the S&P 500 chart set for 1 to 3 months. The Ultimate Oscillator is positive, but moving lower.

Slow Stochastic: For the Slow Stochastic I use the K period of 14 and D period of 3. The Slow Stochastic tries to predict the market direction further out than just one day. The Slow Stochastic has a down or sell signal in place.

Relative Strength Index: The relative strength index is set for a period of 5 which gives it 5 days of market movement to monitor.  It often is the first indicator to show an overbought or oversold signal.  The RSI signal was trying to rise on Friday.

Rate of Change: Rate Of Change is set for a 21 period. This indicator looks back 21 days and compares price action from the past to the present.  The rate of change signal is positive but continuing to move lower.


Support Levels To Be Aware Of:

The market has light support at the 2425, 2400, 2380, 2350 and 2300 levels.


 Stock Market Outlook for Tomorrow – Mon Jun 26 2017

For Monday there are no new signals from the end of last week. The outlook from the technical indicators is still biased positive but moving lower so the outlook is still sideways with a bias to the downside for stocks.


Stay FullyInformed With Email Updates

 Market Direction Internal Links

Profiting From Understanding Market Direction (Articles Index)

How I Use Market Timing

How I Use Market Timing

Understanding Short-Term Signals

Various Market Timing Systems

Market Direction Portfolio Trades (Members)

Market Direction External Links

Market Direction

IWM ETF Russell 2000 Fund Info

Market Direction SPY ETF 500 Fund Info


Recent Outlooks

Stock Market Outlook For Thu May 7 2026 – Bullish and Still Higher

Prior Trading Day Summary On Wednesday stocks soared as strong earnings from Advanced Micro Devices Stock (AMD) sparked another rally. The SPX made another new intraday high as it reached 7369. The index closed up 106 points to end the …

Morning Investing Strategy Notes for Wed May 6 2026

For FullyInformed Members the morning Investing Strategy Notes for Wed May 6 2026 look at the rebound on Tuesday following Monday’s selling.. There are a large number of equities discussed in today’s morning Investing Strategy Notes. They include Palantir Tech …

Stock Market Outlook For Wed May 6 2026 – Choppy But Higher Still

Prior Trading Day Summary On Tuesday stocks again shook off Middle East worries and climbed higher. The SPX made another new intraday high as it reached 7273. The index closed up 58 points to end the day at 7259 on …

Morning Investing Strategy Notes for Tue May 5 2026

For FullyInformed Members the morning Investing Strategy Notes for Tue May 5 2026 look at the dip on Monday and the chance for another lower close today. There are a large number of equities discussed in today’s morning Investing Strategy …

Stock Market Outlook For Tue May 5 2026 – Overbought and Lower

Prior Trading Day Summary On Monday stocks saw some minor pressure and ended the day slightly lower. The SPX lost 29 points to close at 7200 on 5.2 billion shares traded. 63% of all stocks were falling by the close …

Morning Investing Strategy Notes for Mon May 4 2026

For FullyInformed Members the morning Investing Strategy Notes for Mon May 4 2026 look at the chance for a lower close. There are a large number of equities discussed in today’s morning Investing Strategy Notes. They include Palantir Tech Stock …

Stock Market Outlook For Mon May 4 2026 – Dips Likely With Possible Lower Close

Prior Trading Day Summary On Friday stocks continued to push higher on the back of better than estimated earnings from a number of large cap companies. With their stocks continuing to climb, stocks are once more extremely overbought. The SPX …

Morning Investing Strategy Notes for Fri May 1 2026

For FullyInformed Members the morning Investing Strategy Notes for Fri May 1 2026 look at the chance for another closing new high on Friday. There are a large number of equities discussed in today’s morning Investing Strategy Notes. They include …

Stock Market Outlook For Fri May 1 2026 – Overbought But Higher

Prior Trading Day Summary On Thursday earnings from a number of big cap stocks like Alphabet Stock (GOOGL) and Eli Lilly Stock (LLY) helped to push the indexes to new all-time highs yet again. The SPX rose 73 points to …

Morning Investing Strategy Notes for Thu Apr 30 2026

For FullyInformed Members the morning Investing Strategy Notes for Thu Apr 30 2026 look at the odds of a lower day. There are a large number of equities discussed in today’s morning Investing Strategy Notes. They include Alphabet Stock (GOOGL), …

Stock Market Outlook For Thu Apr 30 2026 – Dips Likely Possible Lower Close

Prior Trading Day Summary On Wednesday the SPX closed slightly lower while the NASDAQ closed higher ending the day with a mixed outlook. The SPX fell 3 points to close at 7135 on 5.2 billion shares traded. Just 37% of …

Morning Investing Strategy Notes for Wed Apr 29 2026

For FullyInformed Members the morning Investing Strategy Notes for Wed Apr 29 2026 look at expectations for profits on Wednesday and especially Thursday. There are a large number of equities discussed in today’s morning Investing Strategy Notes. They include Nucor …

Stock Market Outlook For Wed Apr 29 2026 – Choppy But Higher Ahead Of More Earnings

Prior Trading Day Summary On Tuesday both the SPX and NASDAQ lost a little ground but the bigger earnings are set to be released starting tomorrow. The SPX fell 35 points to close at 7178 on 5 billion shares traded …

Morning Investing Strategy Notes for Tue Apr 28 2026

For FullyInformed Members the morning Investing Strategy Notes for Tue Apr 28 2026 look at anticipated market action for today. There are a number of equities discussed in today’s morning Investing Strategy Notes. They include Intel Stock (INTC), Nucor Stock …

Subscribe For The Latest News