
 Thursday saw the NASDAQ manage to hold onto a small gain as health care stocks rallied. Earlier in the day however, all 3 indexes were higher but by the close most of the gains were lost and only the NASDAQ managed a small increase.
S&P Index Close
The S&P index ended the day down 1.11 points to close at 2434.50
Dow Jones Index Close
The Dow Jones ended down 12.74 at 21,397.29
NASDAQ Index Close
The NASDAQ closed up 2.73 points to end the day at 6236.69
Stock Market Outlook
Chart Comments At The Close:
The S&P during the day on Thursday moved down to the 21 day moving average and tried to bounce higher. The bounce failed and the index closed just above the 21 day moving average leaving behind a bearish candlestick for Friday.
You can also see that a potential Bollinger Bands Squeeze is taking shape. Which direction it may push the index, is not known at present. All the other major moving averages are continuing to climb including the 21 day moving average which is bullish. Light support is at the 2425 level.
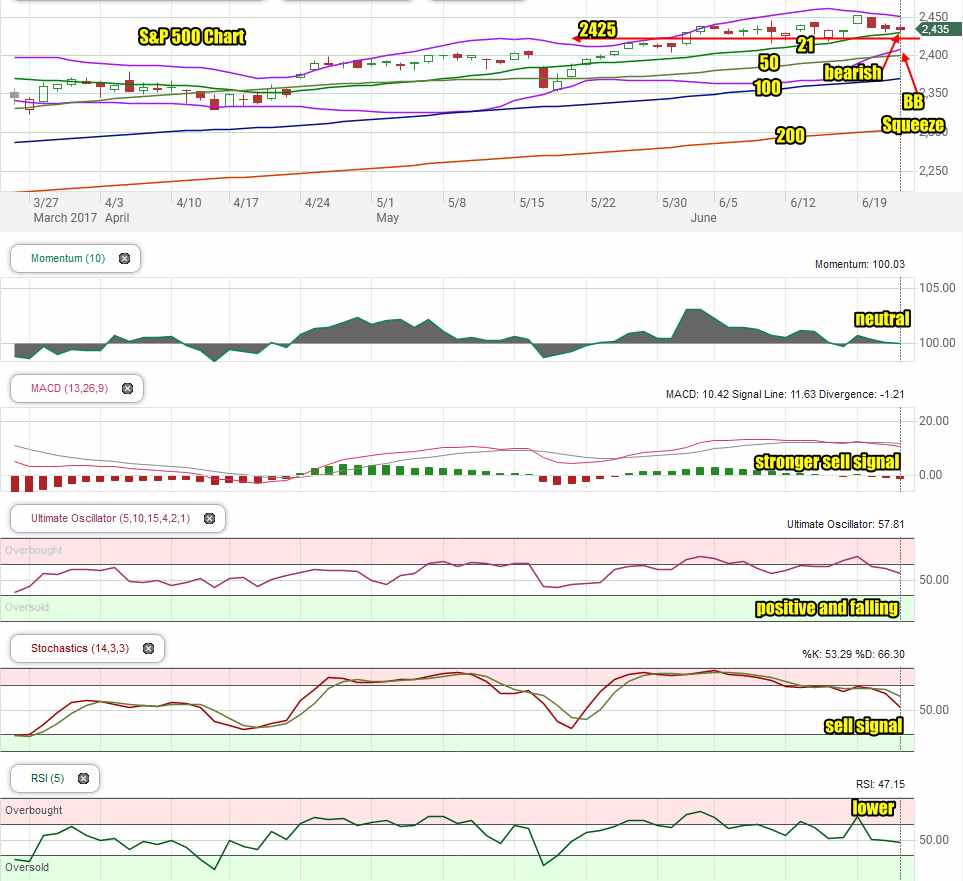
S&P chart to Jun 22 2017
Stock Market Outlook: Technical Indicators:
Momentum: For momentum I use a 10 period when studying market direction. Momentum is neutral again for Friday.
MACD Histogram: For MACD Histogram, I am using the Fast Points set at 13, Slow Points at 26 and Smoothing at 9. MACD (Moving Averages Convergence / Divergence) has issued a sell signal on June 20. Today the sell signal strengthened.
Ultimate Oscillator: The Ultimate Oscillator settings are: Period 1 is 5, Period 2 is 10, Period 3 is 15, Factor 1 is 4, Factor 2 is 2 and Factor 3 is 1. These are not the default settings but are the settings I use with the S&P 500 chart set for 1 to 3 months. The Ultimate Oscillator is positive, but moving lower.
Slow Stochastic: For the Slow Stochastic I use the K period of 14 and D period of 3. The Slow Stochastic tries to predict the market direction further out than just one day. The Slow Stochastic has a down or sell signal in place for Friday.
Relative Strength Index: The relative strength index is set for a period of 5 which gives it 5 days of market movement to monitor. It often is the first indicator to show an overbought or oversold signal. The RSI signal is falling.
Support Levels To Be Aware Of:
The market has light support at the 2425, 2400, 2380, 2350 and 2300 levels.
Stock Market Outlook for Tomorrow – Friday Jun 23 2017
For Friday the market still has a few positive indicators but all indicators continue to pullback. There are two strong sell or down signals in place, one from MACD and the other from the Slow Stochastic.
Friday looks like a repeat performance of Thursday. Stocks should dip near the open in the morning, rally through the lunch hour and then move sideways and finally lower, into the close.
The oulook is still sideways with a bias to the downside.
Stay FullyInformed With Email Updates
Market Direction Internal Links
Profiting From Understanding Market Direction (Articles Index)
Understanding Short-Term Signals
Market Direction Portfolio Trades (Members)
Market Direction External Links
IWM ETF Russell 2000 Fund Info
Market Direction SPY ETF 500 Fund Info